Use case: Configure ForgeRock Identity Cloud to integrate with Web
Author: |
Lucy Billington |
Created at: |
Mar 2023 |
Updated at: |
Mar 2023 |
Use case overview
Integration with identity and access management (IAM) solutions and web analytics tools is a common use case that is easily achieved with ForgeRock Identity Cloud.
There are several methods for integrating web analytics tools and Identity Cloud. These include Single Sign-on (SSO) federation, account synchronization (using connectors), and integration using plugins for data capture. The focus of this article is on integration using plugins for data capture.
Web analytics tools typically require loading or injecting plugins on the client side to capture data, which is then uploaded to the web analytics tool. In this article, we’ll demonstrate two different ways in which you can achieve this in Identity Cloud:
-
Integrating user journeys with Grafana. This involves configuring metric and timer nodes in a user journey to capture relevant data and then integrating with a Grafana dashboard for visualization and monitoring.
Embedding cookie consent controls in user journeys
Embedding cookie consent controls in user journeys in Identity Cloud ensures that users are informed about data collection and have control over their data.
You can integrate Identity Cloud with cookie consent management solutions like OneTrust. By including a OneTrust scripted node in a user journey, you can display cookie consent options in your authentication and self-service flows, similar to this:
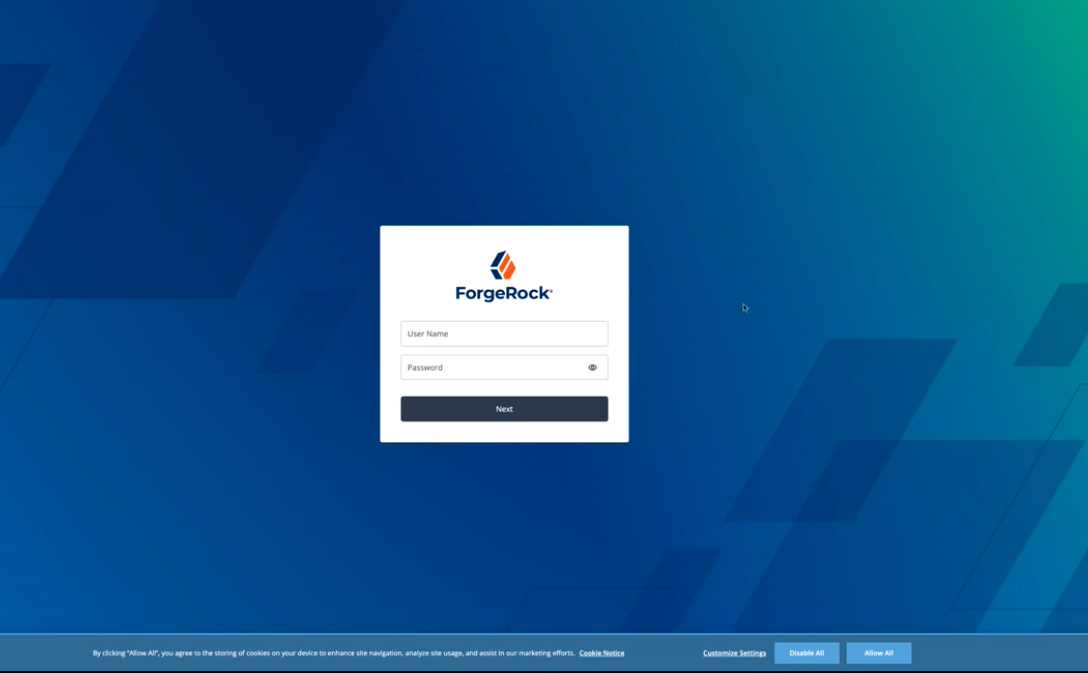
This blog article shows how to easily include a OneTrust Cookie Consent script in your Identity Cloud user journeys to enable cookie consent options.
Integrating user journeys with Grafana
In this example use case, we’ll demonstrate how to create a social login journey that includes meter and timer nodes for capturing the number of events and timings of specific steps. This could be used to compare the time needed for the different authentication methods.
Information on the social and local logins made by users is made available through the standard ForgeRock audit logs and can be used with third-party tools such as a Grafana dashboard to get quick visibility of the different amount of times that is used by the different methods.
This use case has three parts:
-
Create a social journey with timers
-
Run through the end user journey taking social and local login options, to generate test data
-
Configure the Grafana dashboard and view the login data
Prerequisites
-
You have configured and enabled one or more social identity providers in Identity Cloud. See Social authentication for further information.
-
You have downloaded and run a Docker-based example Grafana dashboard. The demo requires that you have Docker Desktop installed, and requires macOS.
See Monitor system for performance for further information.
-
You have a test user with a social account for your enabled social provider(s) (such as Google).
Create a social journey with timers
-
Sign in to the Identity Cloud admin UI using your admin tenant URL, in the format
https://<tenant-name>/am/XUI/?realm=/#/. -
Go to Journeys > New Journey.
-
Enter a unique name for the social journey, select which identities will authenticate using this journey, (optionally) enter a journey description, and click Save.
-
Create a journey similar to this:

Node descriptions: * Use Social Provider? - This is a Choice Collector node that defines two or more options to present to the user when authenticating. See Step 5 for further information on configuring this node. * Social Login - This is a Select Identity Provider node that presents the user with a list of enabled social identity providers to use for authentication. * Platform Username - Prompts the user to enter their username. See Platform Username node for further information. * Platform Password - Collects the user’s password. See Platform Password node for more information. * Social/Local Login Start nodes - These are Meter nodes that increment a specified metric key each time evaluation passes through the node. See Step 6 and Step 7 for further information on configuring these nodes. * Social/Local Login Timer Start nodes - These are Timer Start nodes that start a named timer metric for the social or local login, which you stop with a corresponding Timer Stop node. See Step 6 and Step 7 for further information on configuring these nodes. * Social Provider Handler - Takes the provider selection from the Select Identity Provider node and attempts to authenticate the user. See Social Provider Handler node for further information. * Data Store Decision - Verifies that the username and password values match those in the data store configured for the realm. See Data Store Decision node for further information. * Social/Local Login Timer Stop nodes - These are Timer Stop nodes that record the time elapsed since evaluation passed through the Timer Start node in the specified metric name. See Step 6 and Step 7 for further information on configuring these nodes. * Increment Login Count - Increments the successful login count property of a managed object. See Increment Login Count node for further information. * Inner Tree Evaluator - Nest an authentication flow as a child within the journey. See Inner Tree Evaluator node for further information.
-
Click the Use Social Provider? node (Choice Collector node) and configure the following:
-
Choices:
Yes, use social,` No, use local` -
Default Choice:
Yes, use social -
Prompt:
Use Social Provider?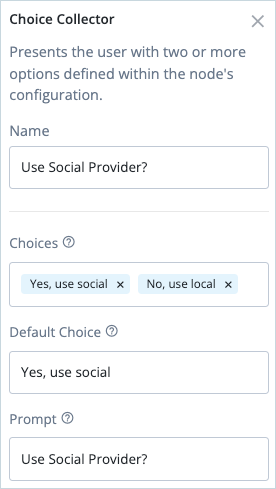
-
-
Configure timers for Social login:
a. Click the Social Login Start node (Meter node) and enter the Metric Key for social login, for example,
social.login.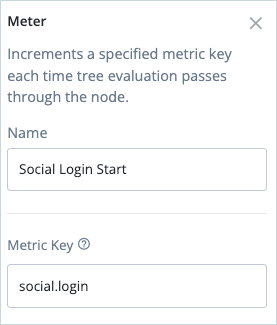
b. Click the Social Login Timer Start node and enter the Start Time Property for social login, for example,
social.login.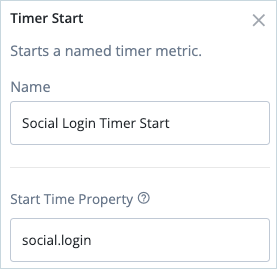
c. Click the Social Login Timer Stop node linked to “Account exists” and enter the Start Time Property () and a Metric Key, for example,
social.login.s(where.sindicates success).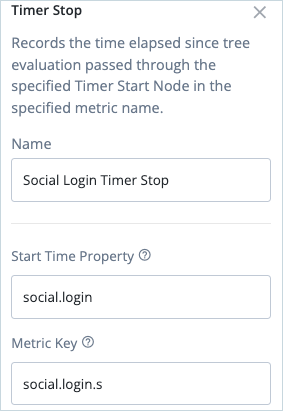
d. Click the Social Login Timer Stop node linked to “No account exists” and enter the Start Time Property () and a Metric Key, for example,
social.login.f(where.findicates failure).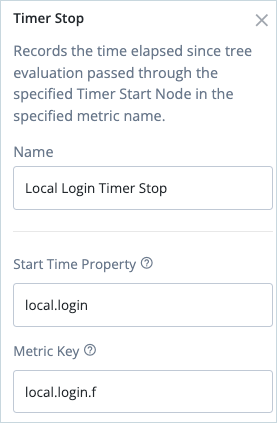
-
Configure timers for Local login:
-
Click the Local Login Start node (Meter node) and enter the Metric Key for local login, for example,
local.login.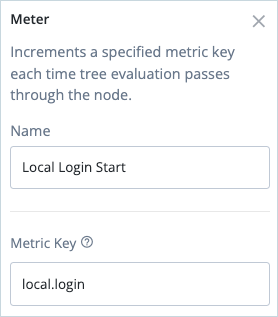
b. Click the Local Login Timer Start node and enter the Start Time Property for local login, for example,
local.login.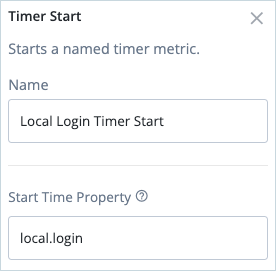
c. Click the Local Login Timer Stop node linked to “Account exists” and enter the Start Time Property (
local.login) and a Metric Key, for example,local.login.s(where.sindicates success).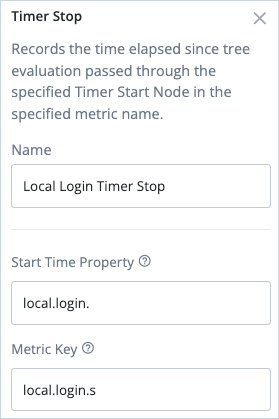
d. Click the Local Login Timer Stop node linked to “No account exists” and enter the Start Time Property (
local.login) and a Metric Key, for example,local.login.f `(where `.findicates failure).
-
-
Click the Inner Tree Evaluator node and select the ProgressiveProfile journey. This will request progressive profile attributes as the user proceeds with login.
-
Click Save to save the journey.
Run through the end user journey with different social and local logins
In this step we’ll run through several end user social and local logins in order to generate test data for Grafana reporting.
-
In the Identity Cloud admin UI, go to Journeys.
-
Click the social login journey with timers (you created previously) and copy the Preview URL.
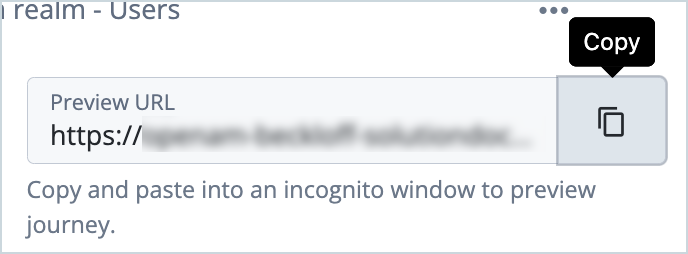
-
Paste the preview URL into a browser using Incognito or Browsing mode.
-
Select
Yes, use socialand click Next.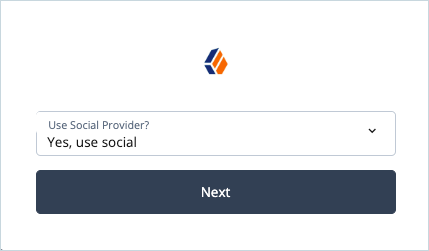
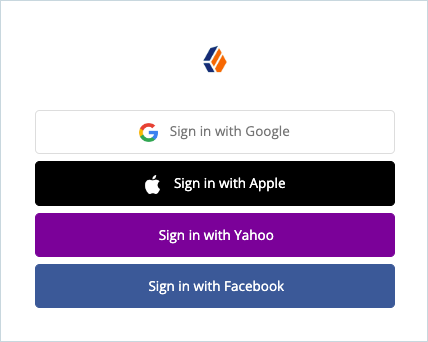
-
Select a social provider and follow the steps to sign in to Identity Cloud using the social provider.
-
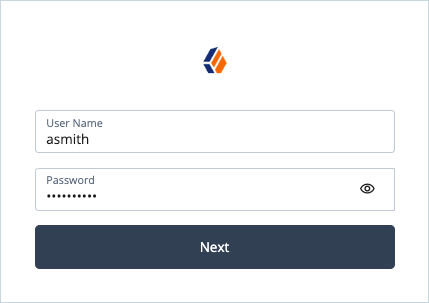
Repeat Steps 3 and 4, this time selecting
No, use local.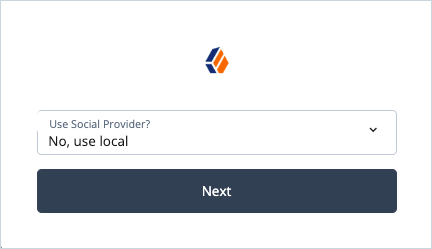
-
Enter the test user’s username and password and click Next to sign in.
-
Repeat the steps above multiple times using different social and local logins in order to generate test data.
Configure the Grafana dashboard and view the results
In this step, we’ll configure a simple Grafana dashboard that monitors login data for the social journey you created previously and view the results for both social and local logins.
-
Download and run a Docker-based example of a Grafana dashboard (if you haven’t already done so).
-
On the Grafana Home page, go to Dashboards > New Dashboard.
-
Click Add a new Panel.
-
Click Query and select the first metric you want to report on. In this case, we’ll choose
am.local_login_s_seconds_total.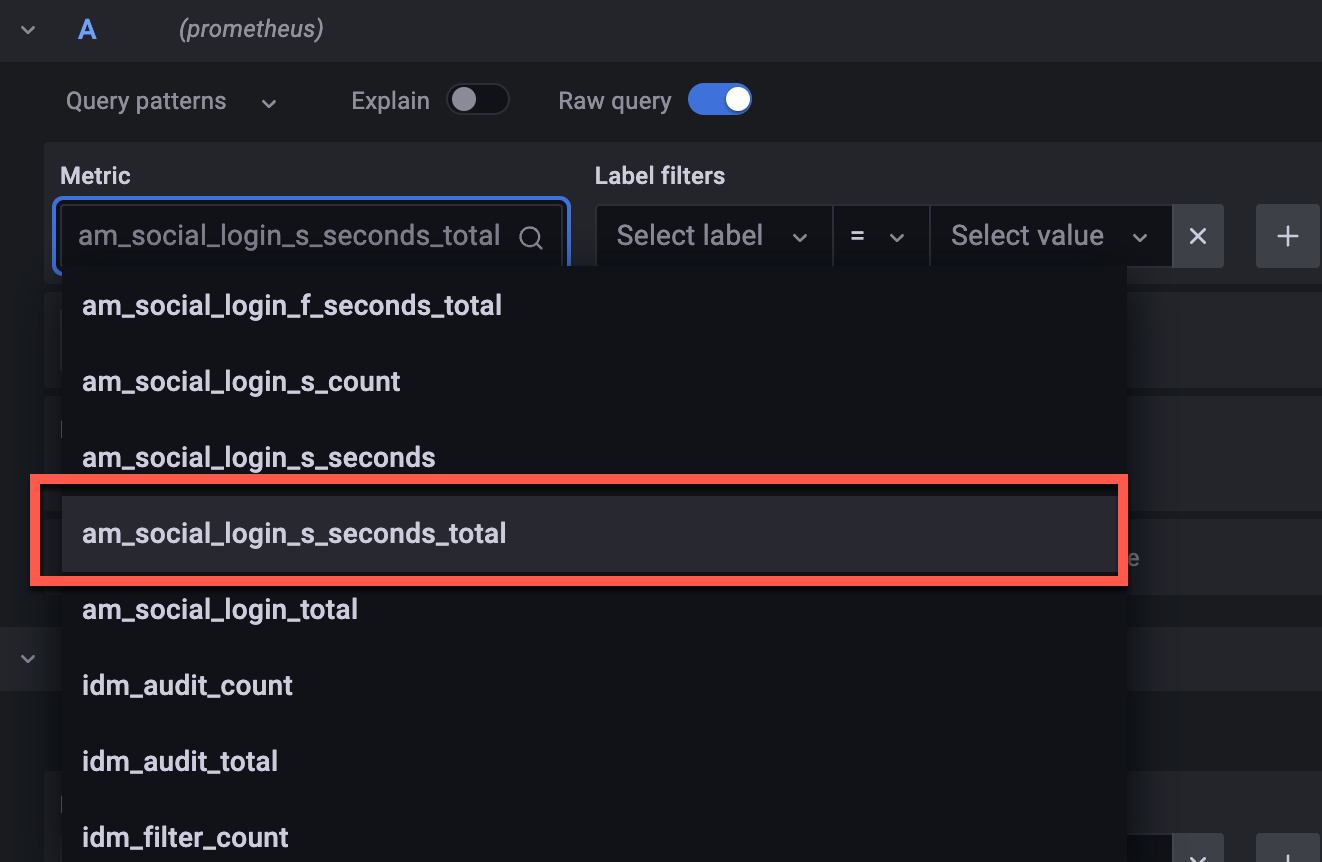
-
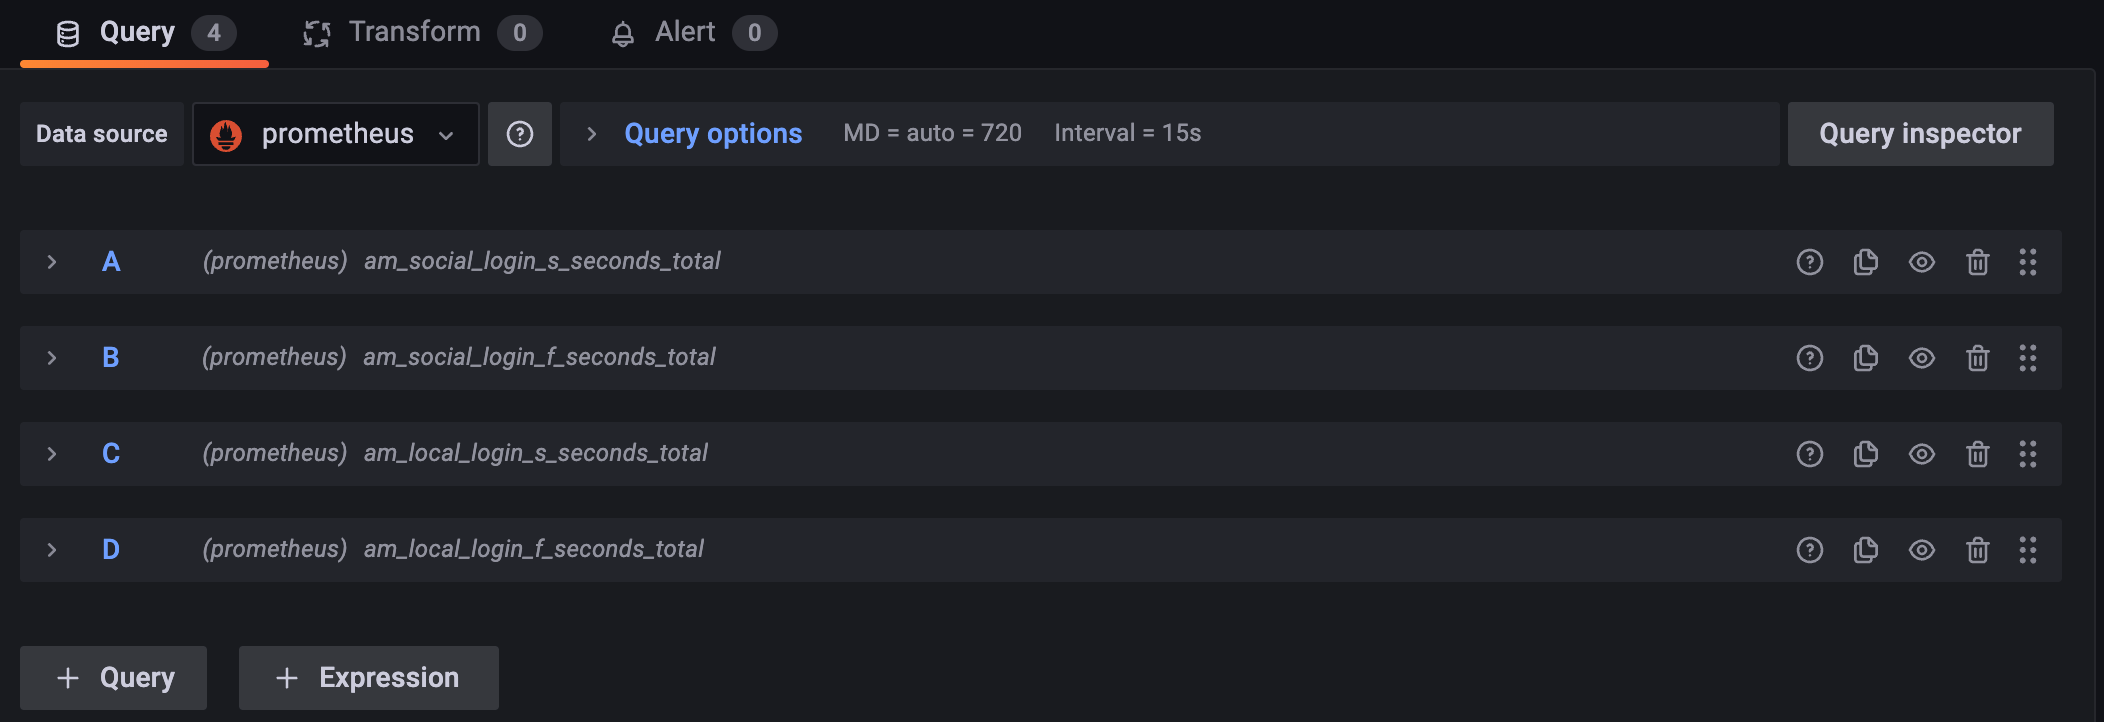
Click + Query to add another query.
-
Repeat Steps 4 and 5 for the remaining counts and timings you want to report on.
-
Click Last 6 hours and change the time range (optional).
-
Enter the panel title, for example, Local vs. Social Logins.
-
Click Apply.
A graph showing local and social logins for the selected time period is displayed.
-
Click on the metrics for social login and local login and compare the login times. For example:
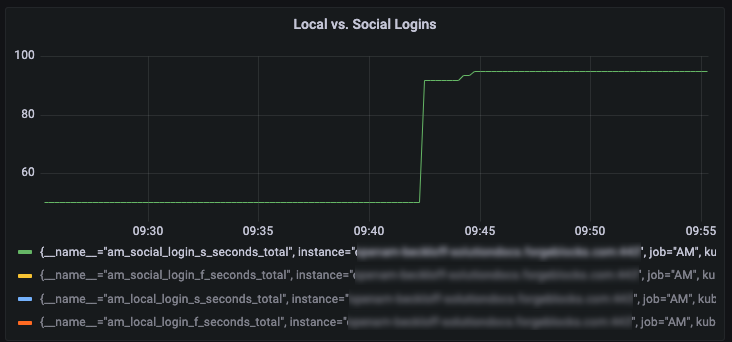
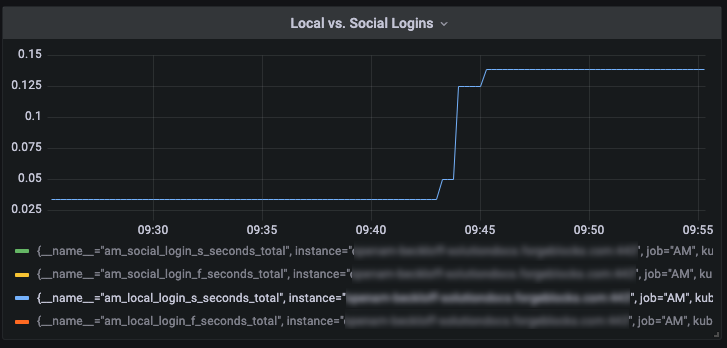
The scale on the left represents the login time, in seconds. Notice that this is adjusted accordingly for longer (social) or shorter (local) login times.
-
Click Save to save the dashboard.