ForgeRock Identity Cloud: Reporting and auditing user activities
Author: |
Lucy Billington |
Created at: |
Aug 2023 |
Updated at: |
Aug 2023 |
Overview
The ability to report on and audit activities is an important capability of identity and access management (IAM) systems. This includes the ability to track all user authentication and application activity, including failed authentications.
ForgeRock Identity Cloud offers several capabilities for reporting and auditing user activities. These include:
Monitoring user journeys for success rates
What is it?
By monitoring and tracking user journeys for success rates, you can report on the success or failure of each end-user experience and identify the areas where users abandon or fail an authenication journey.
How is it achieved in Identity Cloud?
The Identity Cloud analytics dashboard provides valuable insights on your Identity Cloud tenants, including monitoring the number of user engagements, monitoring user authentication journeys, accessing journey pass/fail details, and viewing the top five journeys by outcome and usage.
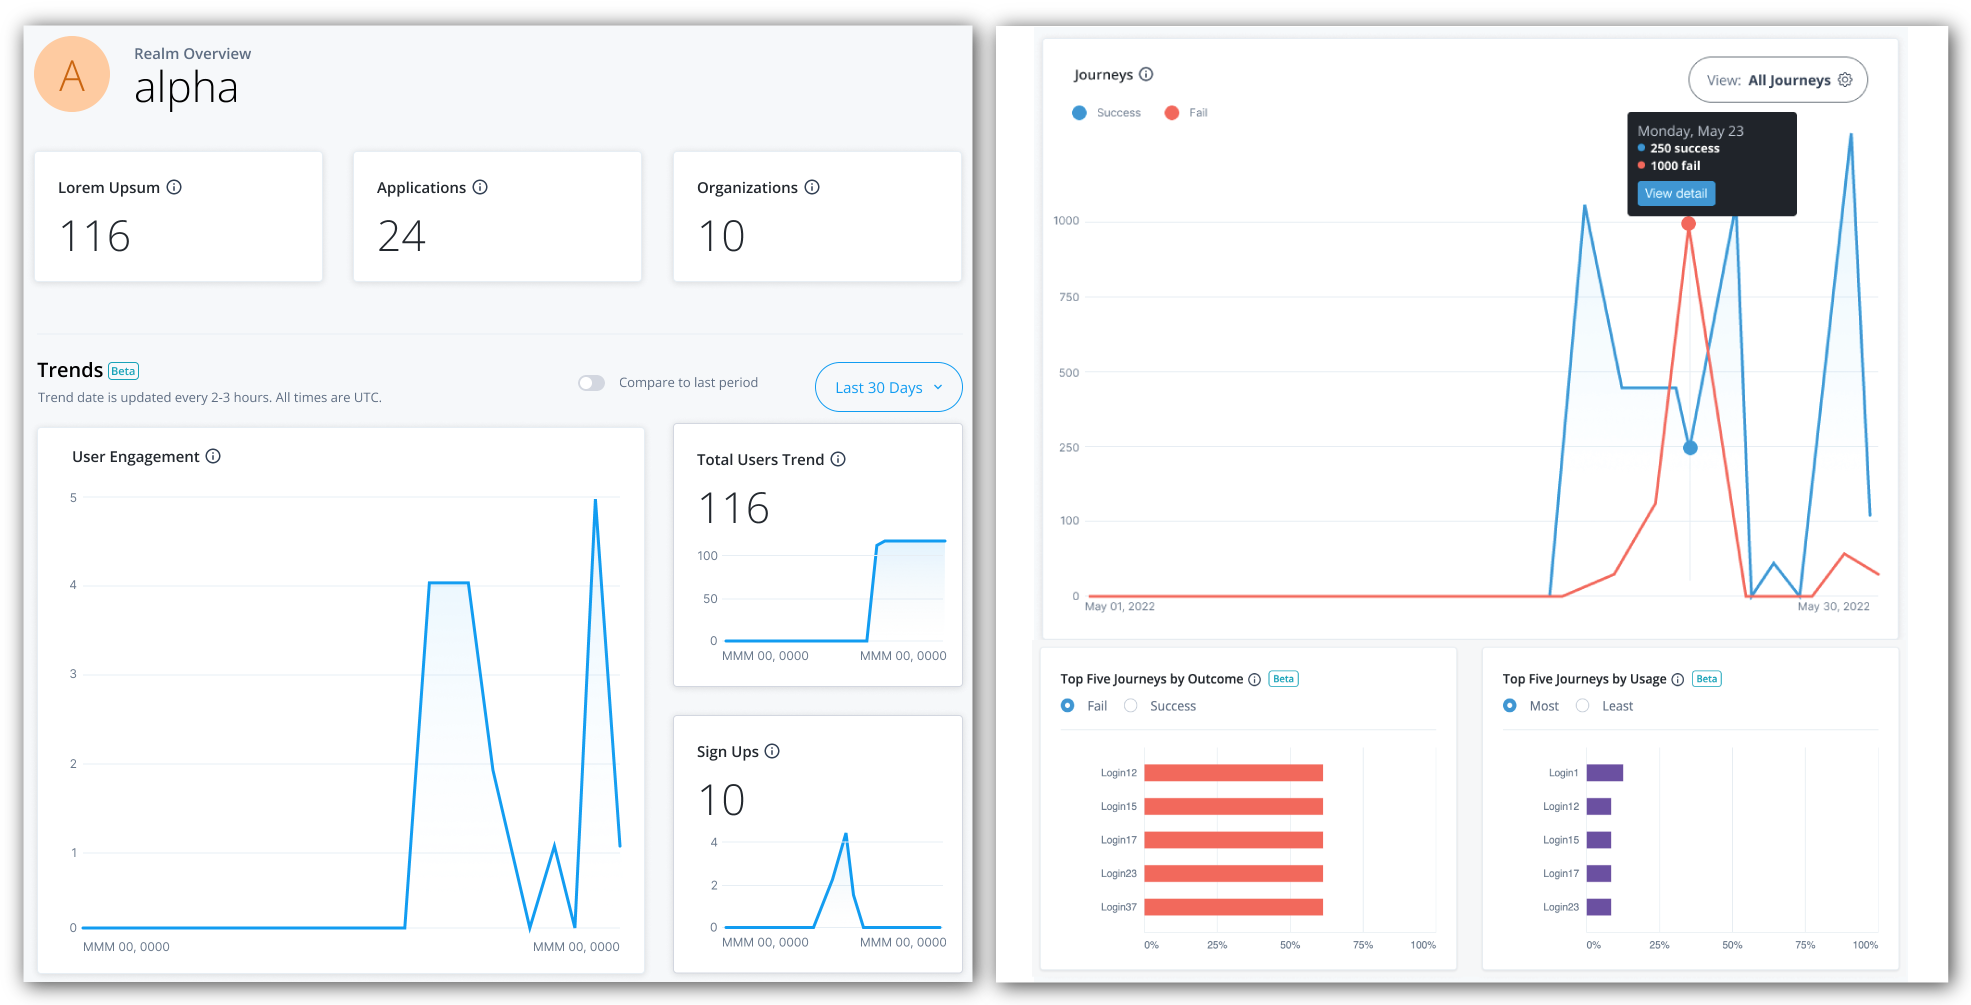
Identity Cloud analytics dashboard - example
Using the data on the Journeys pane, you can easily see which journeys are succeeding or failing. The red lines indicate user journeys that have failed and blue lines indicate successful journeys. You can drill down at specific points to view the number or percentage of failures per journey.
Journeys that aren’t successful can then be updated to deliver better experiences similar to the successful journeys.
For further information on the Identity Cloud analytics dashboard and user journeys, see:
Business benefits
The ability to track all user authentication (including failed authentication) and application activity allows organizations to evaluate different customer journeys and identify journeys that are not providing the best user experience. This is particularly important for CIAM use cases where you want to offer the best customer outcome.
External reporting tools
What is it?
With external reporting tools, you can report on user behaviors, which could range from exporting data to a security information and event management (SIEM) tool for real-time alerts, or to an external reporting tool to deliver audit reports of identity activities.
How is it achieved in Identity Cloud?
Identity Cloud includes a REST API-based audit logging service across all its components. The audit service captures all auditing events critical for system security, troubleshooting, usage analytics and regulatory compliance. Audit data is held for 30 days and can be downloaded via a read-only REST API using API keys.
With Identity Cloud’s enterprise-grade REST API, you can send audit data to external data analytics and reporting tools. This data can show the success and failure rates of user journeys as well as alert you to any potential security incidents. Audit logs are commonly consumed by third-party SIEM and analytics tools such as Splunk, ArcSight and FireEye.
The community-supported ForgeRock Identity Cloud app for Splunk captures audit and debug logs from Identity Cloud tenants. It includes a sample dashboard to graphically illustrate various captured metrics, for example, authentication events, identity registrations, and top active users.
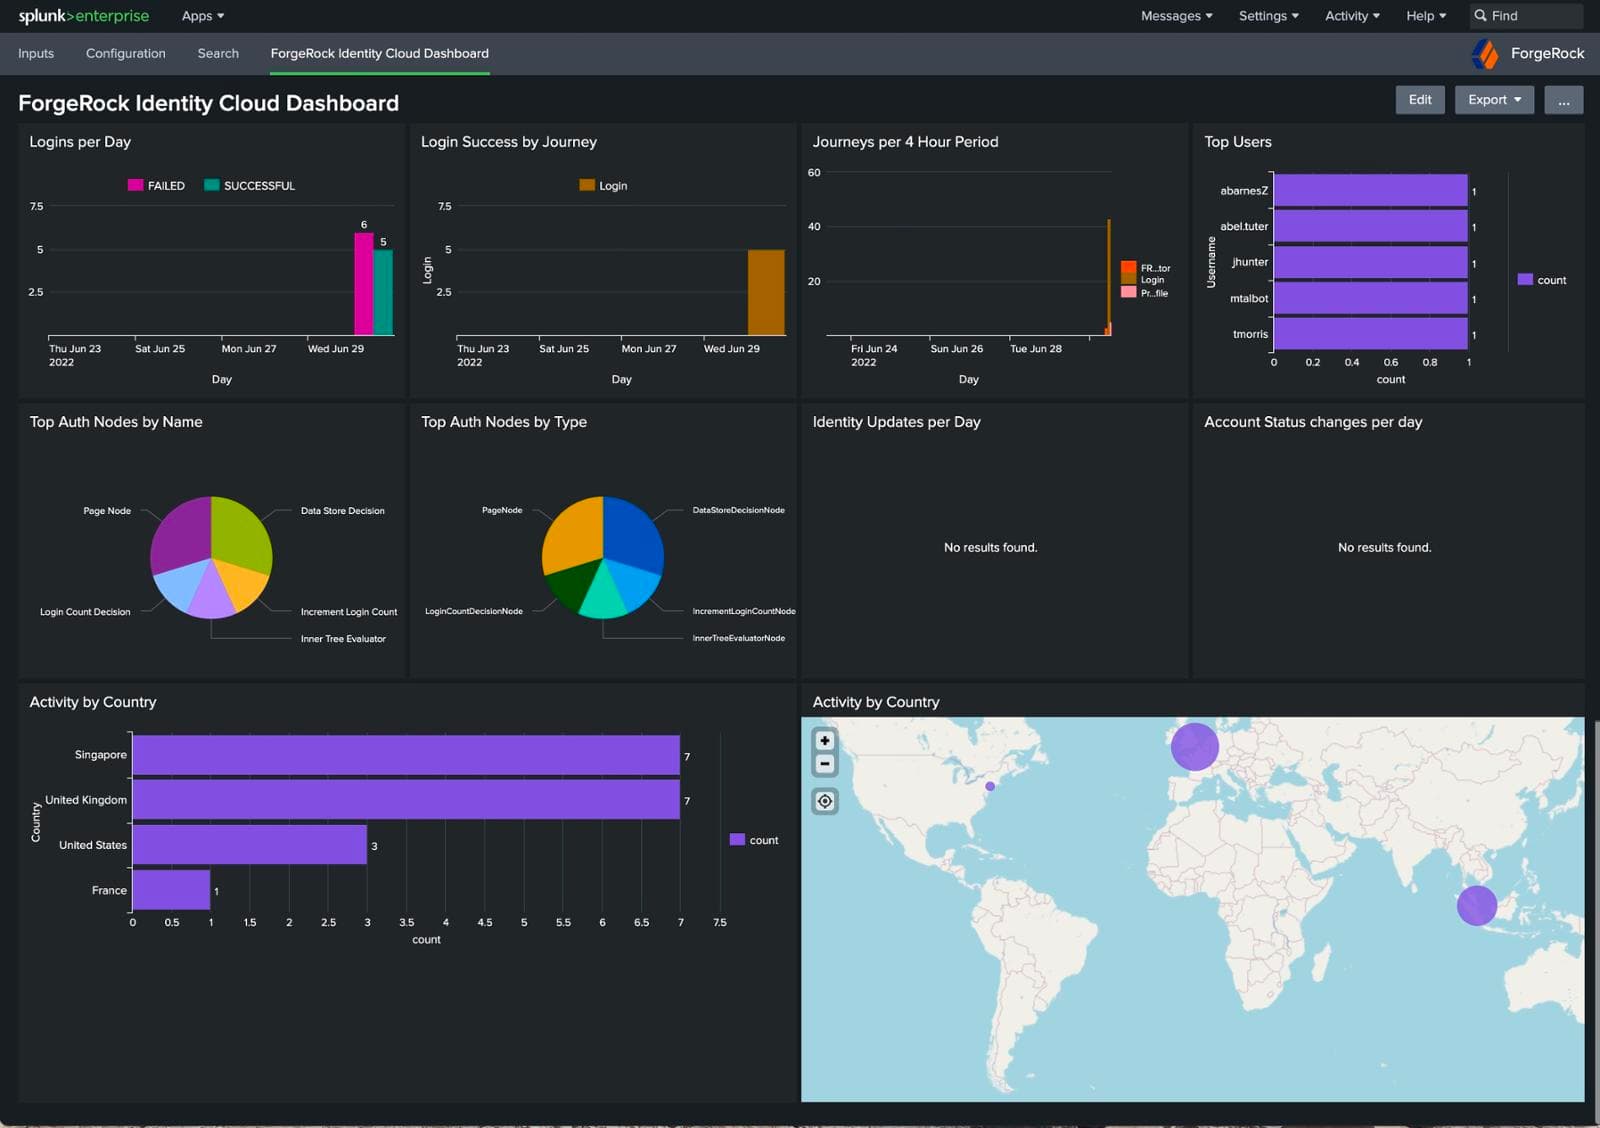
Example Identity Cloud tenant Splunk dashboard
For further information on setting up and using the ForgeRock Identity Cloud app for Splunk, see How do I set up the ForgeRock Identity Cloud app for Splunk?
NOTE: The ForgeRock Identity Cloud app for Splunk is a community app provided independently from ForgeRock. It is provided on an “as is” basis, without warranty of any kind, to the fullest extent permitted by law.
Identity Cloud provides monitoring endpoints that can be used with Prometheus. Prometheus formatted metrics for identity management and access management can be consumed by third-party tools such as Grafana.
ForgeRock provides a Docker-based example Grafana demo dashboard for download.
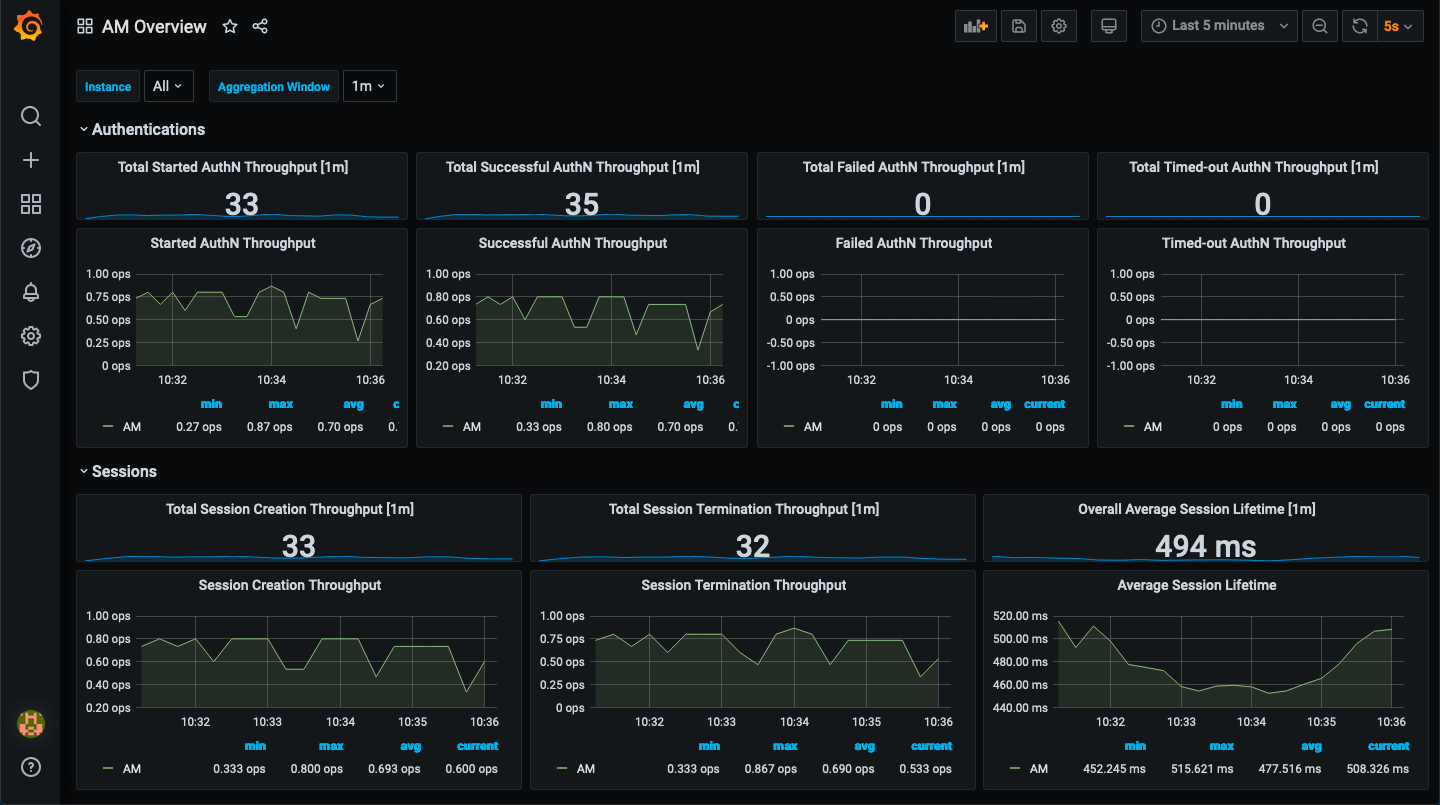
Grafana dashboard showing Identity Cloud authentications data for the
last 5 minutes
The data captured for reporting is configurable. For example, you can add Meter and Timer nodes to your Intelligent Access journeys. These metrics are captured in real-time and relayed to third-party tools such as Prometheus to be displayed on Grafana dashboards.
For an example of using Timer and Meter nodes to compare social and local login times on a Grafana dashboard, see Integrating user journeys with Grafana
For further information on Identity Cloud auditing and external reporting tools, see:
Business benefits
Usage analytics help provide data for meeting service level agreements (SLAs), measuring performance, and gaining greater insight into how end users and their devices interact with applications and services. Visuals displayed in a third-party dashboard allow organizations to quickly and intuitively understand complex data, making it easier to identify trends, patterns, and anomalies.
Many login statistics can be captured and analyzed, which is useful not only for performance monitoring, but also for providing valuable insight into customer behavior, such as the number of logins from desktops vs mobiles, social vs local logins, browser versions, operating system versions, geolocations, or times of day.
Dashboards such as Grafana can display real-time data, enabling organizations to monitor applications and processes in real time. This helps in early detection of security issues and faster response times.
Alternative (A/B) testing
With A/B testing, you can compare alternative implementations of user journeys (A and B). An example of when you may want to use A/B testing is to compare different journeys for rates of abandonment during registration.
How is it achieved in Identity Cloud?
Providing reports on alternative (A/B) testing for user journeys is easily achieved with Identity Cloud.
With Intelligent Access journeys, you can deploy multiple methods to accomplish the same task. This means you can deploy and report on two or more versions of the same journey to test to see which delivers the most successful completion of tasks. The results can be used to deploy only the best user experience
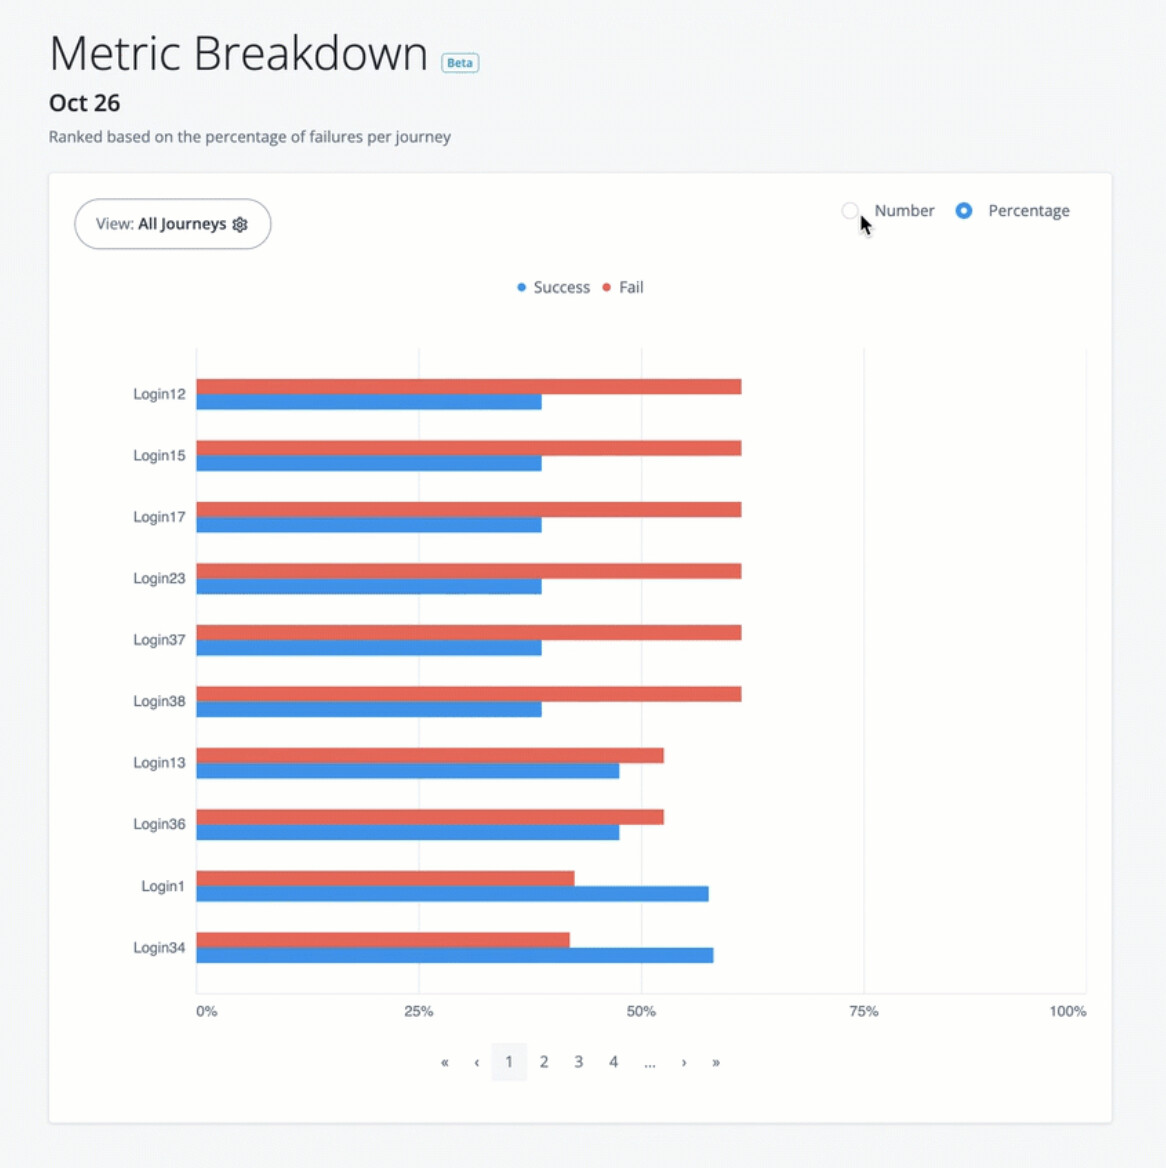
You can use the Identity Cloud analytics dashboard to compare different journeys and assess the success rate of each. The Metric Breakdown on the dashboard shows a number or percentage of each user journey success or failure for a specified time period.
Another way in which you can achieve A/B testing is to create a single Intelligent Access journey that times different A/B paths using Timer nodes. Information on user authentications is made available through the standard ForgeRock audit logs and can be used with third-party tools such as Grafana dashboards. You can use Grafana to report on the different paths taken by end users. For an example of how you achieve this, see Creating a user journey that times different A/B paths.
For further information on achieving A/B testing with Identity Cloud, see:
Business benefits
A/B testing allows organizations to make decisions based on concrete data rather than assumptions or opinions. This leads to more informed choices when implementing user journeys.
By refining the user experience through iterative testing, organizations can enhance the customer journey and increase the likelihood that users will complete an authentication.