Use case: Configure reports for supporting alternative (A/B) testing
Author: |
Lucy Billington |
Created at: |
Mar 2023 |
Updated at: |
Mar 2023 |
Use case overview
Providing reports on alternative (A/B) testing for user journeys is a common use case that is easily achieved with ForgeRock Identity Cloud. An example of when you may want to use A/B testing is to compare different journeys for rates of abandonment during registration.
In this use case, we’ll demonstrate how to:
-
Use the Analytics dashboard to compare different journeys.
-
Create a journey that times different A/B paths, and use Grafana to report on the different paths taken by end users.
Using the Analytics dashboard
You can use the built-in Analytics dashboard to gain valuable insights on your Identity Cloud tenants, including accessing a breakdown of journey failure or success and comparing different journeys.
A comprehensive overview of the Analytics dashboard is provided in the product documentation. See Identity Cloud analytics dashboard for further information.
To access the Analytics dashboard and view journey details:
-
Sign in to the Identity Cloud admin UI using your admin tenant URL, in the format
https://<enant-name>/am/XUI/?realm=/#/. -
Click Dashboard to view the Analytics dashboard for the selected Realm.
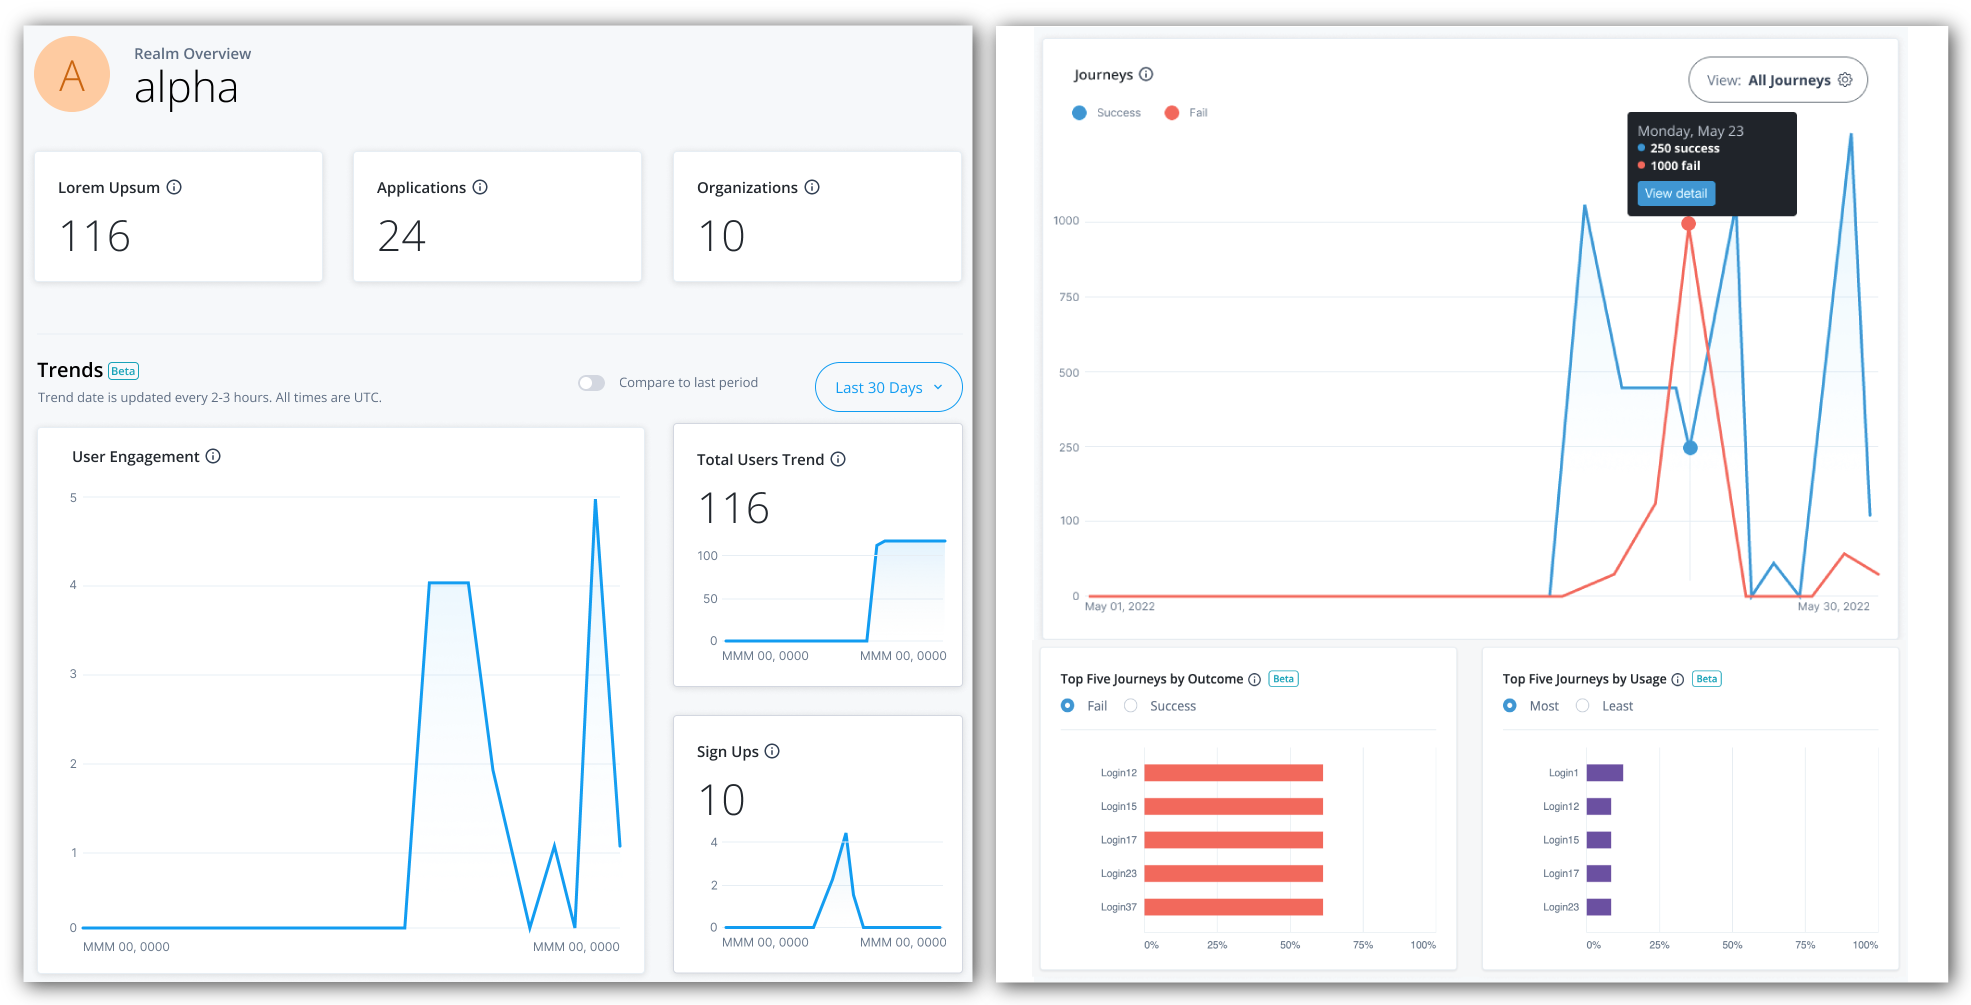
Example Analytics dashboard -
Click Last 30 days if you want to change the time period for the trendline charts. All dates and time periods are based on UTC time.
-
Click Compare to last period to compare the trendline for the last time period. A dotted line represents the trendline for the previous time period
-
Scroll down to view the Journeys graph.
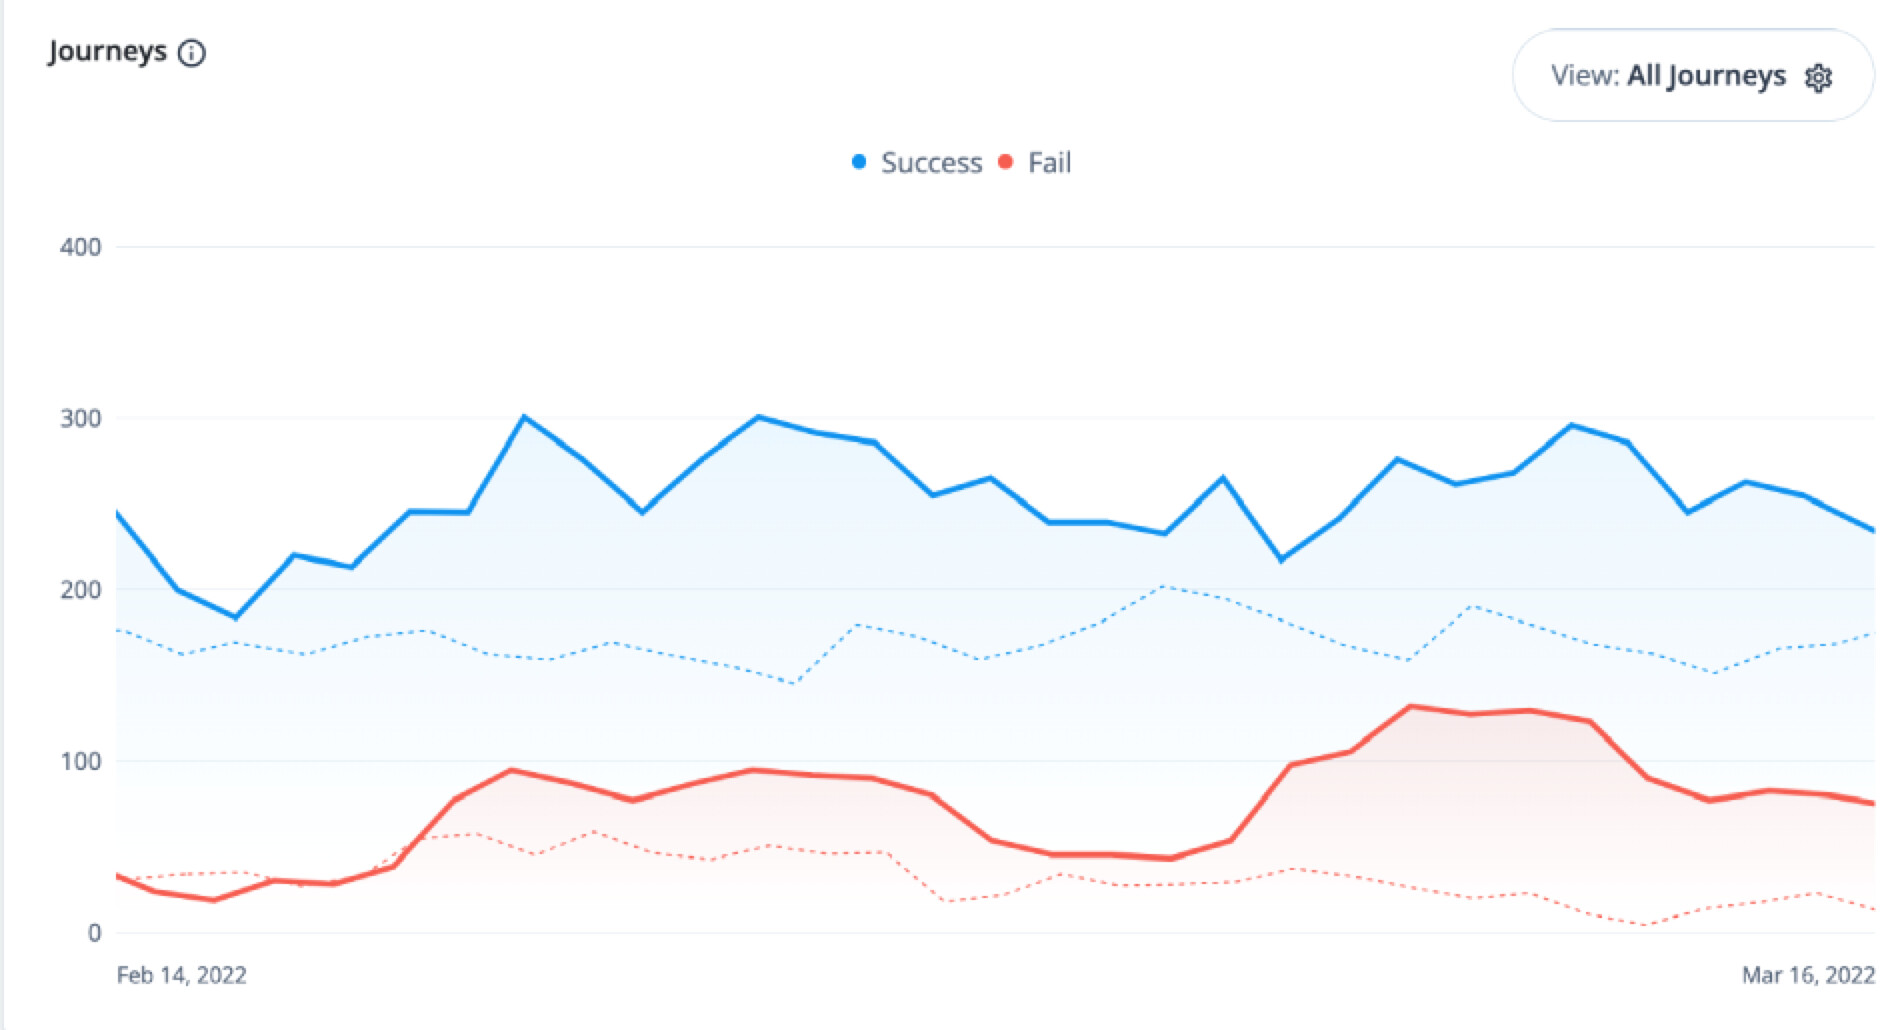
Example Journeys graph
NOTE: To filter the journeys shown, click View All Journeys and select the journeys or categories you want to view.
-
Place your cursor on the point on the trendline and click View Detail to get a metric breakdown, by percentage or number.
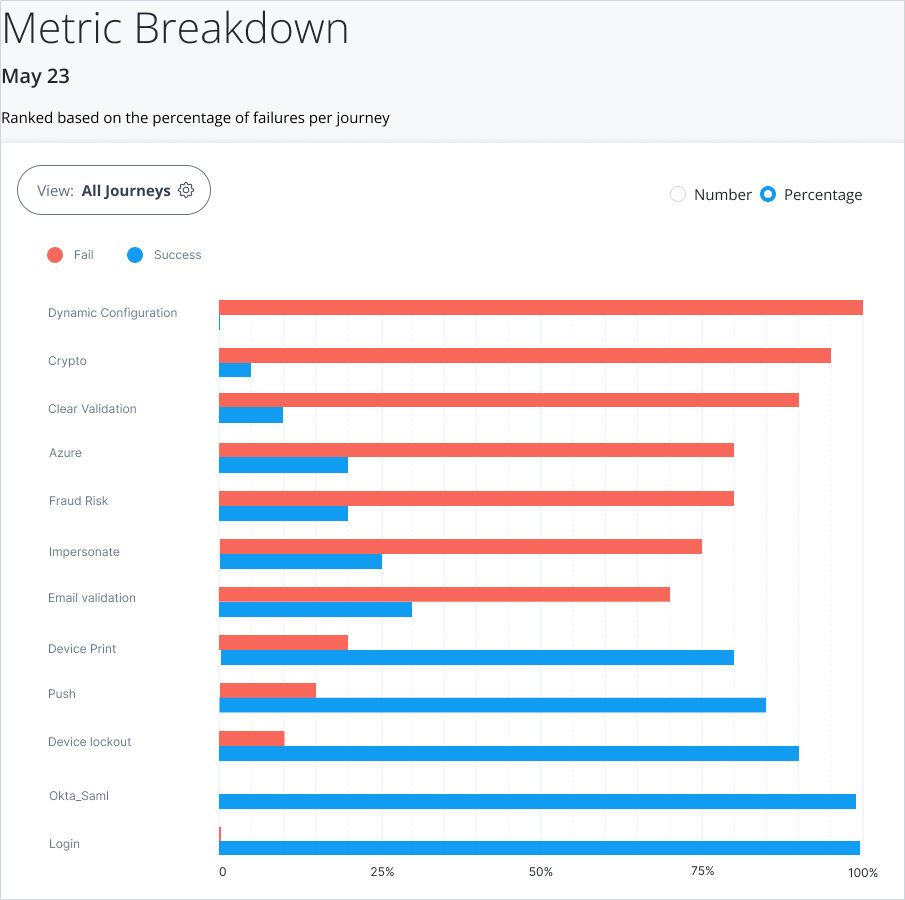
Example failure and success of journeys by percentage
See Access journey pass/fail details for further information on getting a metric breakdown for journeys.
Creating a user journey that times different A/B paths
In this example we’ll demonstrate how to build a simple journey with two branches, named A and B. The journey includes Timer Start and Timer Stop nodes that provide monitoring endpoints which you can use with Prometheus. This allows you to report on the A and B paths taken by users, via third-party tools such as Grafana.
This use case has three parts:
-
Create a user journey
-
Run through the end user journey taking different A/B paths
-
Configure the Grafana dashboard and view the A/B path results
Prerequisites
First, you’ll need to download and run a Docker-based example Grafana dashboard. The demo requires that you have Docker Desktop installed, and requires macOS.
See Monitor system for performance for further information.
Create a user journey
-
Sign in to the Identity Cloud admin UI using your admin tenant URL, in the format
https://<tenant-name>/am/XUI/?realm=/#/. -
Go to Journeys > New Journey.
-
Enter a unique name for the A/B timer journey, select which identities will authenticate using this journey, (optionally) enter a journey description, and click Save.
-
Create a journey similar to this:
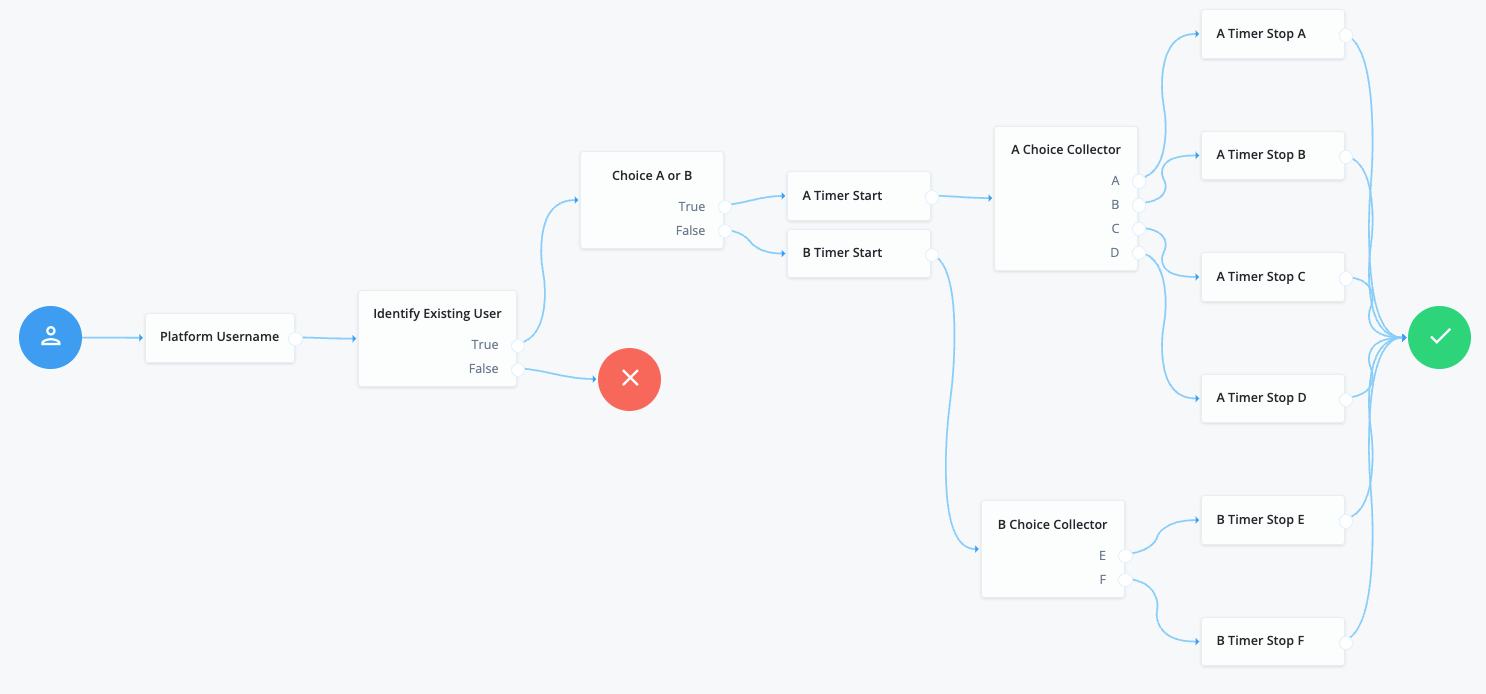
Node descriptions: * Platform Username - Prompts the user to enter their username. See Platform Username node for further information. * Identity Existing User - Checks the username against the identity repository. See Identify Existing User node for further information. * Choice A or B - This is a Message node that prompts the user to choose a path, either A or B. * Timer Start nodes - Starts a named timer metric, which you stop with a Timer Stop node. See Timer Start node for further information. * Choice Collector nodes - Defines two or more options to present to the user when authenticating. See Choice Collector node for further information. * Timer Stop nodes - Records the time elapsed since evaluation passed through the Timer Start node in the specified metric name. See Timer Stop node for further information.
-
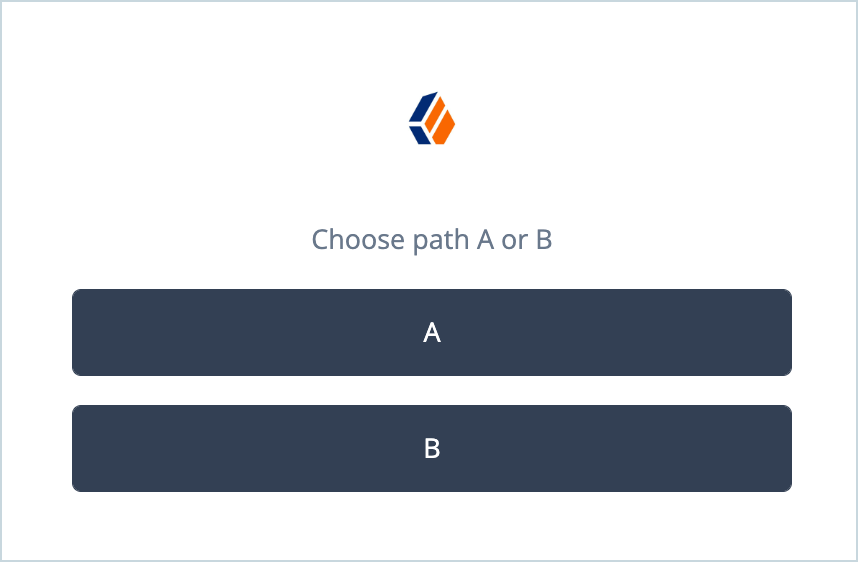
Click the Choice A or B node (Message node) and add the message that will be presented to end users, for example,
Choose path A or B.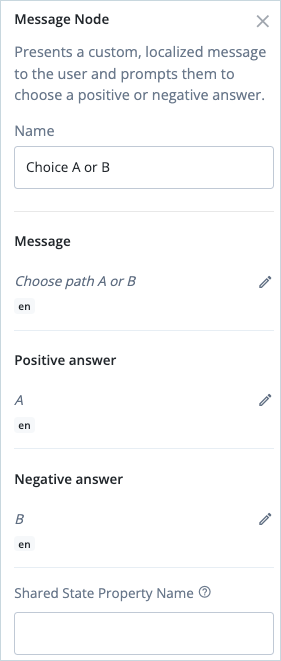
-
Click the A Timer Start node and enter the Start Time Property, for example,
authentication.A.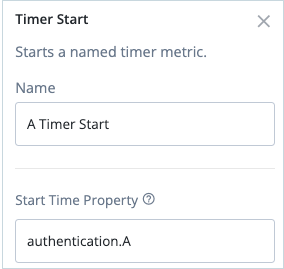
-
Click the B Timer Start node and enter the Start Time Property, for example,
authentication.B. -
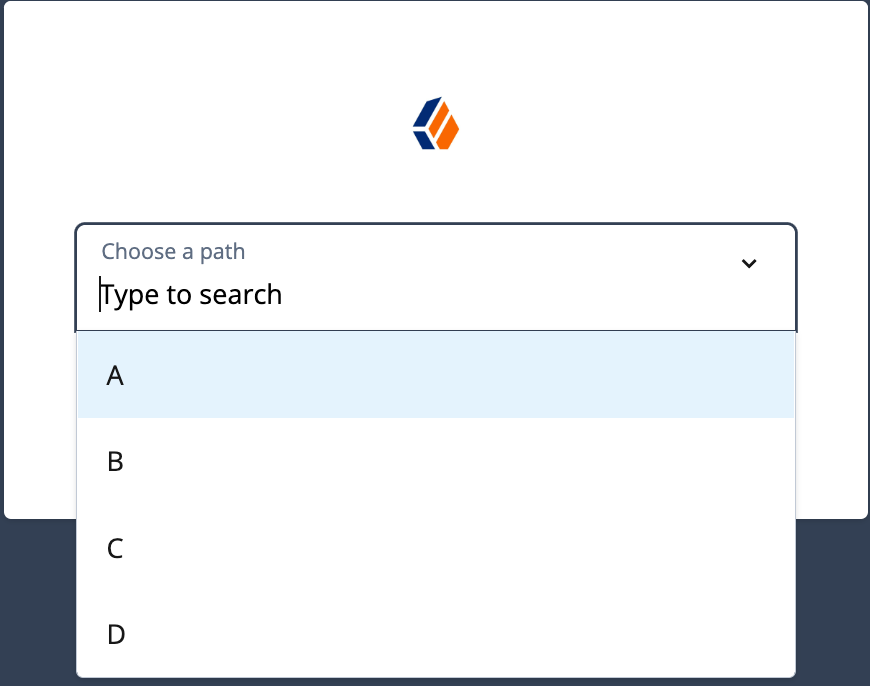
Click A Choice Collector node and configure the following:
-
Choices:
A,B,C,D -
Default Choice:
A -
Prompt:
Choose a path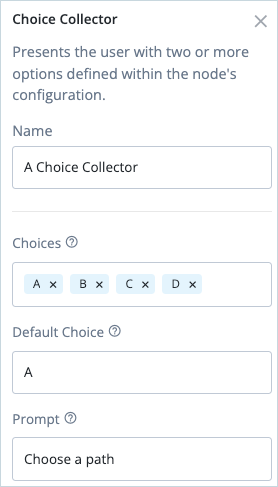
-
-
Click B Choice Collector node and configure the following:
-
Choices:
E,F -
Default Choice:
E -
Prompt:
Pick E or F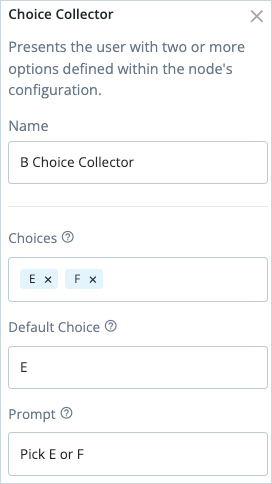
-
-
For each of the A Timer Stop nodes:
-
Configure the Start Time Property to match the Start Time Property in the A Timer Start node, for example,
authentication.A. -
Configure the Metric Key as the identifier of metric to update when this node is processed, for example,
authentication.A.Afor A Timer Stop A,authentication.A.Bfor A Timer Stop B, and so on.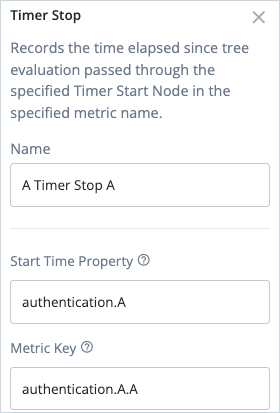
-
-
For each of the B Timer Stop nodes:
-
Configure the Start Time Property to match the Start Time Property in the B Timer Start node, for example,
authentication.B. -
Configure the Metric Key as the identifier of metric to update when this node is processed, for example,
authentication.B.Efor B Timer Stop E andauthentication.B.Ffor B Timer Stop F.
-
-
Click Save to save the journey.
Run through the end user journey taking different A/B paths
In this step we’ll run through the end user journey several times, taking different paths, in order to generate test data for reporting purposes.
-
In the Identity Cloud admin UI, go to Journeys.
-
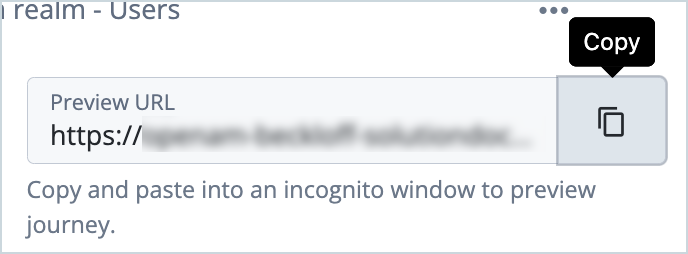
Click the A/B journey you created previously and copy the Preview URL.
-
Paste the preview URL into a browser using Incognito or Browsing mode.
-
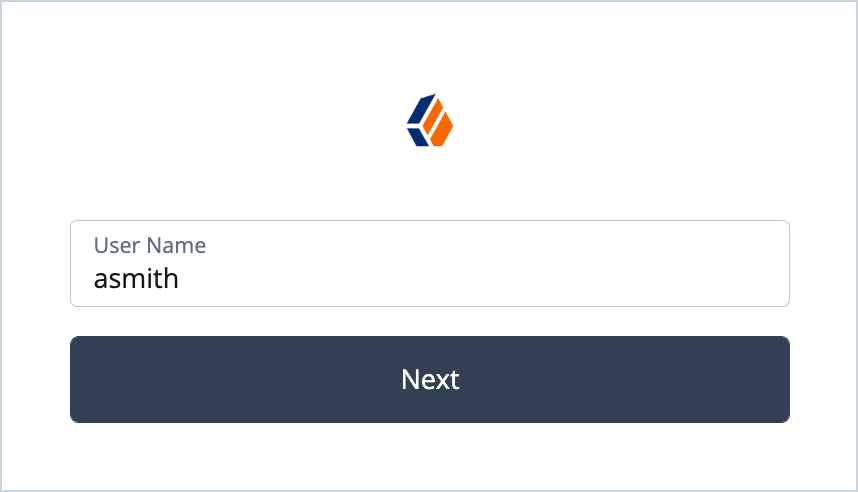
Enter a test user’s username in the Sign In screen and click Next.
-
Click either A or B.
-
Select a path, A, D, C, D or E, F (depending on your selection in the previous step).
-
Repeat Steps 3 through 6 multiple times using different users and taking different paths.
Configure the Grafana dashboard and view the results
For this use case, we’ll create a simple Grafana dashboard that provides a count based on the metric keys in the A/B journey and displays a count of the different paths taken by end users in a pie chart.
-
Download and run a Docker-based example of a Grafana dashboard (if you haven’t already done so).
-
On the Grafana Home page, go to Dashboards > New Dashboard.
-
Click Add a new Panel.
-
Click Query and select the first metric you want to report on. In this case, we’ll choose
am.authenticaton_a_a_count.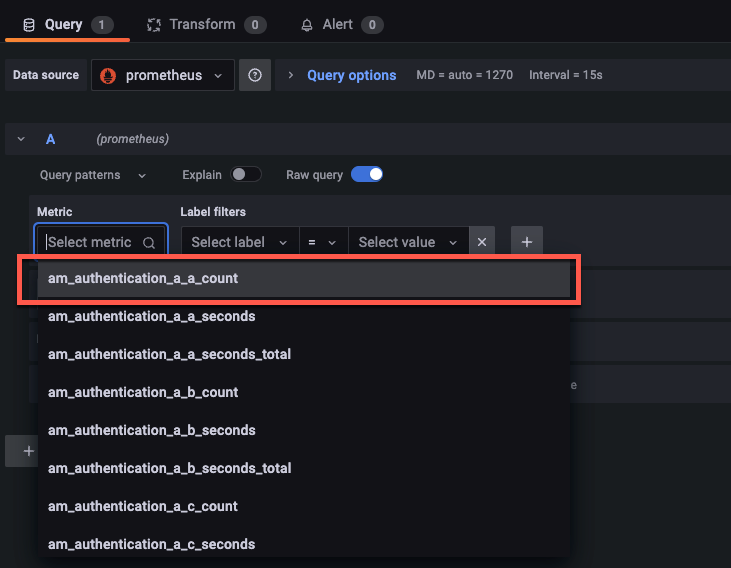
-
Click + Query to add another query.
-
Repeat Steps 4 and 5 for the remaining counts (
am.authenticaton_a_b_countthrough` am.authenticaton_b_f_count`).
-
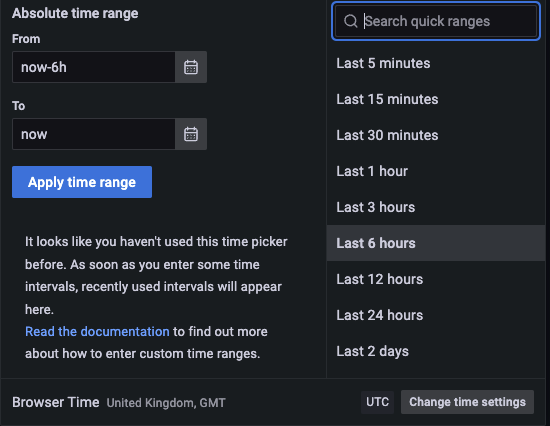
Click Last 6 hours and change the time range (optional).
-
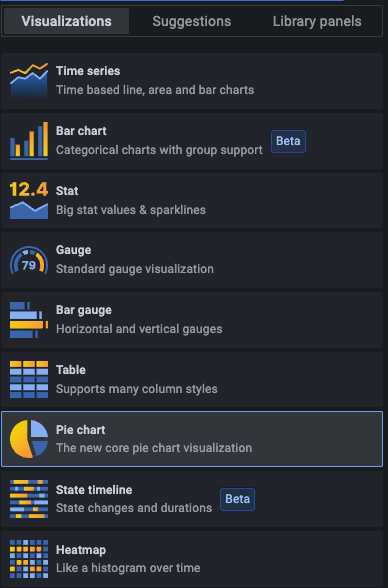
Click Time Series > Visualizations and select Pie Chart.
-
Enter the panel title, for example, “Journey Path Total count over Time”.
-
Click Apply.
The pie chart is displayed, showing a count of the different paths end users have taken.
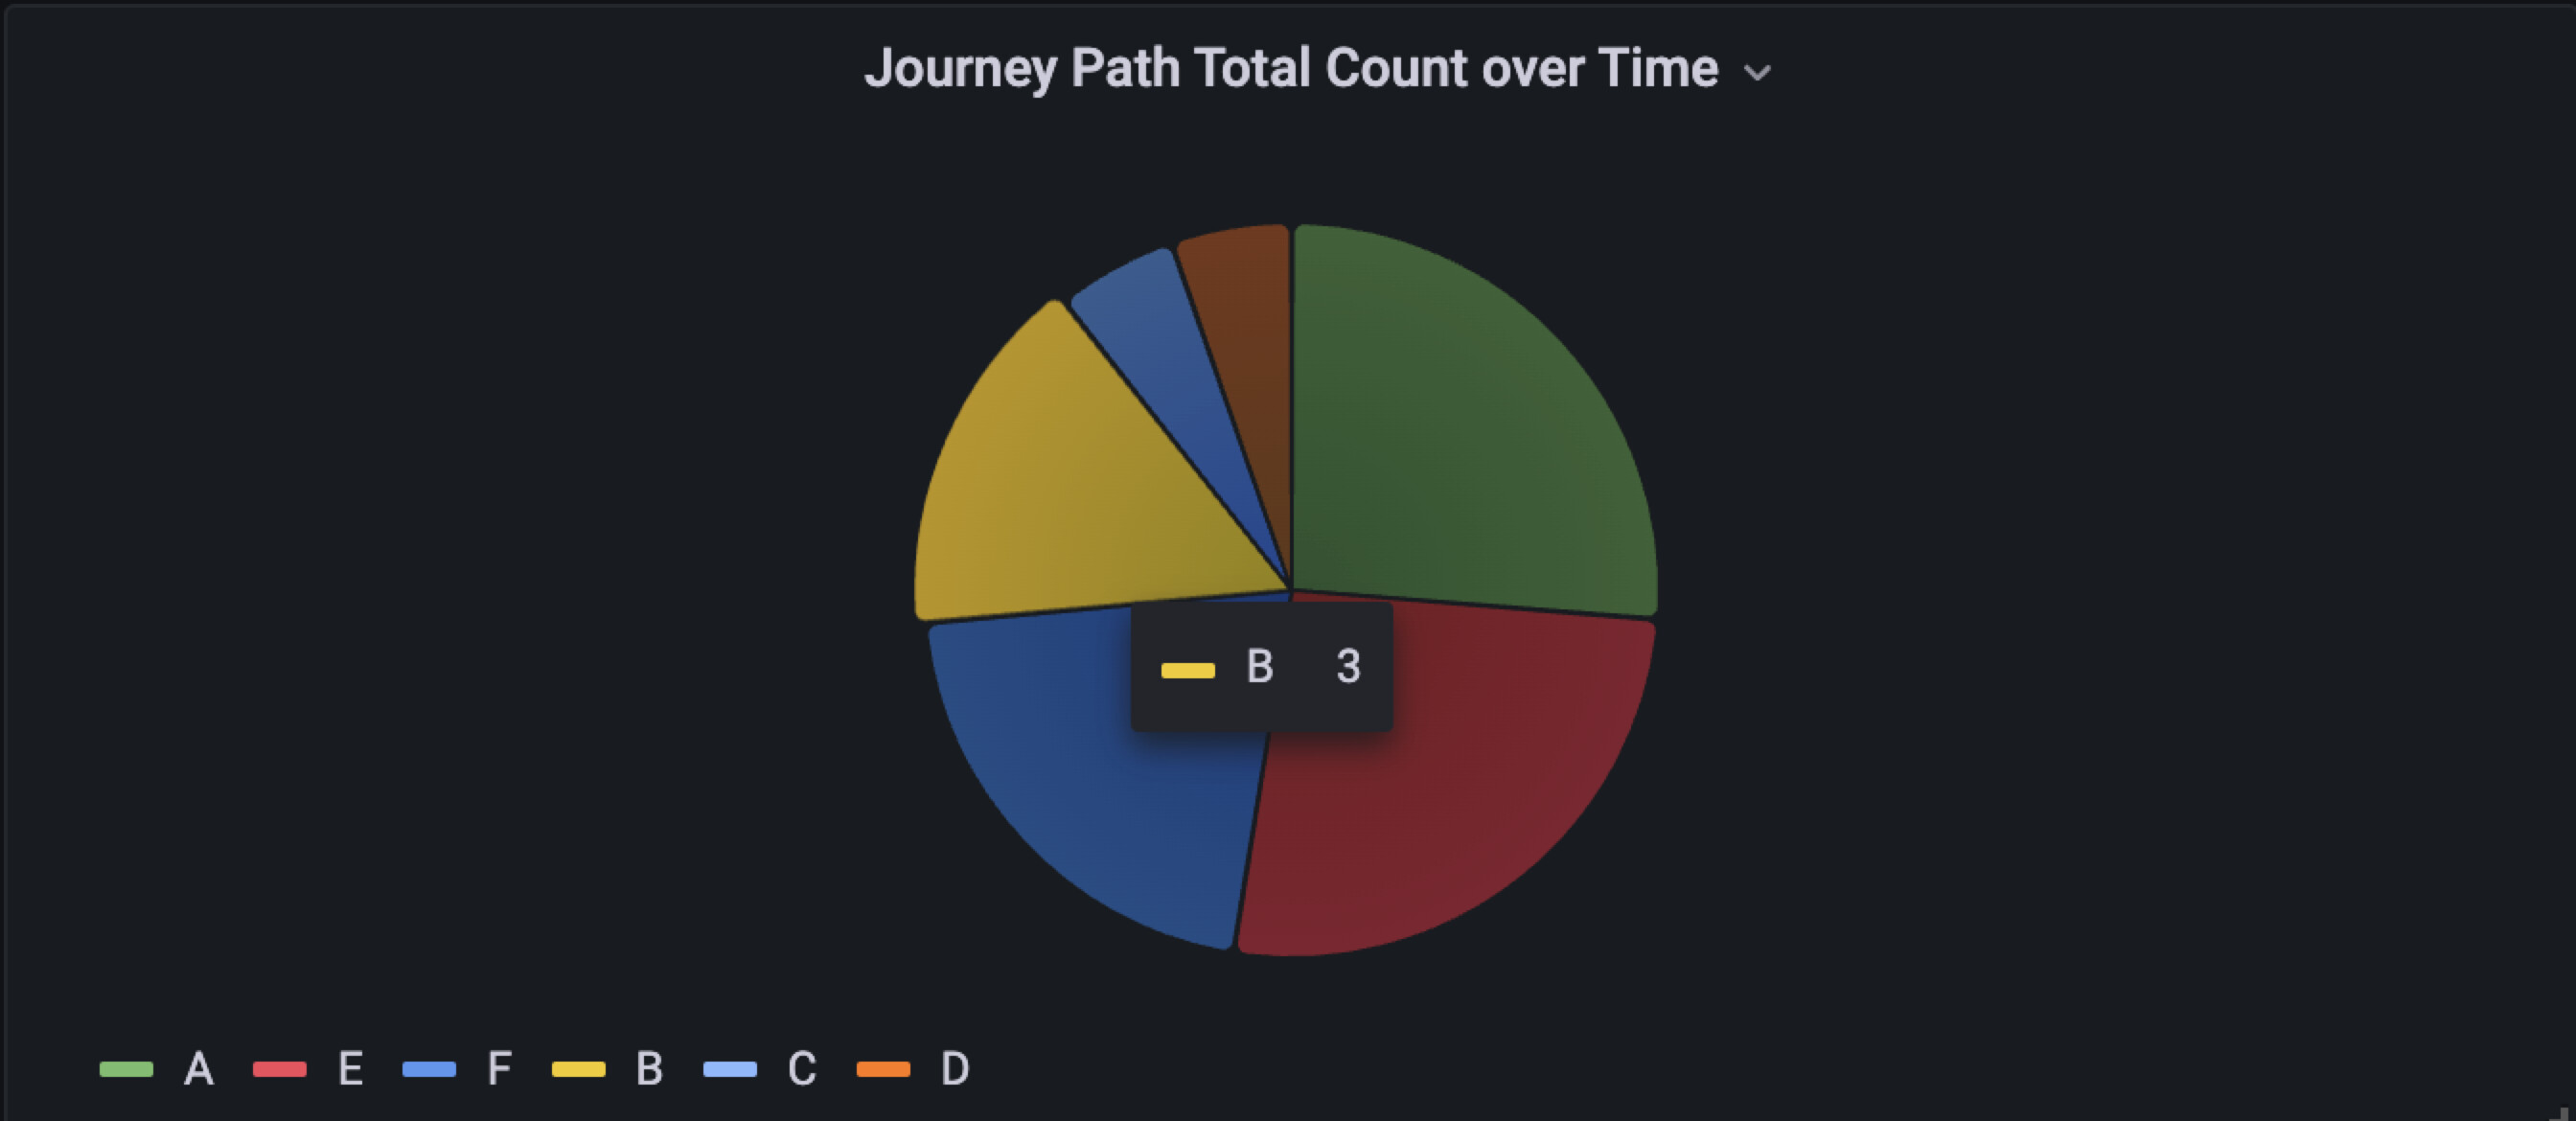
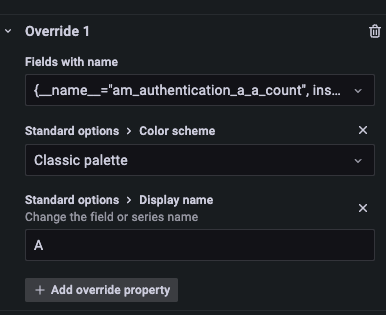
TIP: To display the labels on your pie chart as A, B, C, etc. rather than the metric text you can use overrides. Click Overrides > Add field override > Fields with name and choose the metric. Then click Add override property and enter the text you want to display.
-
Click Save to save the dashboard.