Integrating ForgeRock Identity Platform with Prometheus and Grafana,
Author: |
Stephane Orluc |
Created at: |
Mar 2020 |
Updated at: |
Mar 2023 |
In an earlier article, I showed how ForgeRock Identity Platform, Prometheus, and Grafana can be integrated. In this article, I’ll explain how to configure Prometheus, as well as use Grafana dashboard examples provided by ForgeRock for each of these components.
In the Previous Episode
At the end of the earlier article, all ForgeRock components were exposing Prometheus metrics. Now, let’s configure Prometheus to pull this information, and Grafana to display it in dashboards:
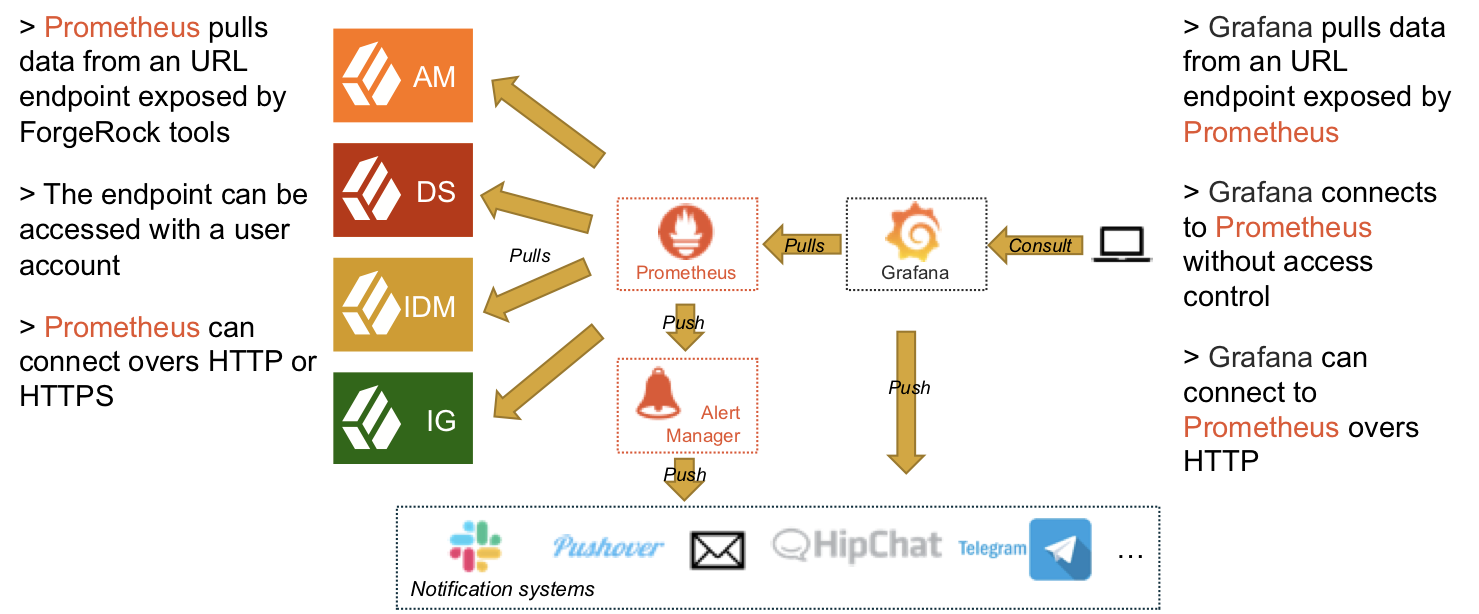
Configuring Prometheus and Grafana
Note: These instructions assume that you have Prometheus and Grafana running.
Configuring Prometheus
Prometheus is configured in a .yml file. The default location of this file is the root folder of your Prometheus setup. In this file, you define the polling frequency, the alerting system, the various datasources to poll, and so on.
For detailed documentation on the Prometheus .yml file, see the Prometheus documentation.
To configure Prometheus to poll for ForgeRock’s Prometheus endpoints, we will add a few lines in the scrape_configs section of the file. These lines include:
-
-
job_name. Used to start a subsection dedicated to the configuration of a datasource (target) you want to connect to with Prometheus. It is also equal to the name of the datasource you will see in your Prometheus web interface.
-
-
scrape_interval and scrape_timeout. These parameters are used to define how frequently Prometheus will poll the datasource and the polling’s timeout, respectively.
-
static_configs. Creates a subsection that we use to define the datasource hostname and port.
-
targets. Parameter used in the static_configs subsection to define the datasource hostname, and the port to use to connect to the datasource.
-
metrics_path. This is the absolute URL path where Prometheus will get the metrics from the datasource.
-
scheme. This is the protocol used to connect to the endpoint (for ForgeRock, it is either http or https).
-
tls_config. This is used to start a subsection to define certificates to trust, and for https connections with the datasource. See the Prometheus documentation for information on how to use this parameter.
-
basic_auth. Creates a subsection that we use to configure Basic auth parameters to be used by Prometheus to connect to the datasource .
-
username and password. Parameters used in the basic_auth subsection to define the basic auth login and password.
Following is an example of the static_configs section for ForgeRock components:
- job_name: '<DataSourceName>'
     scrape_interval: 5s
     scrape_timeout: 5s
     static_configs:
       - targets: [<ServerName>:<PortNumber>]
     metrics_path: '<EndpointURL>'
     scheme: <Scheme>
     tls_config:
       insecure_skip_verify: true

     basic_auth:
       username: '<PromLogin>'
       password: '<PromPassword>'
In this example, is equal to the name you want to give to the datasource (ex: “AM 65”). is equal to the hostname of the Forgerock component you want to monitor (ex.: am65.forgerock). is equal to the port number where the ForgeRock component is publishing the Prometheus metrics (it may be 8080 for HTTP or 8443 for HTTPS). The is equal to the URL path where the metrics are exposed by ForgeRock (the defaults are: /openam/json/metrics/prometheus for AM, /openidm/metrics/prometheus for IDM, /opendj/metrics/prometheus for DS, and /openig/json/metrics/prometheus for IG). can be either http or https.
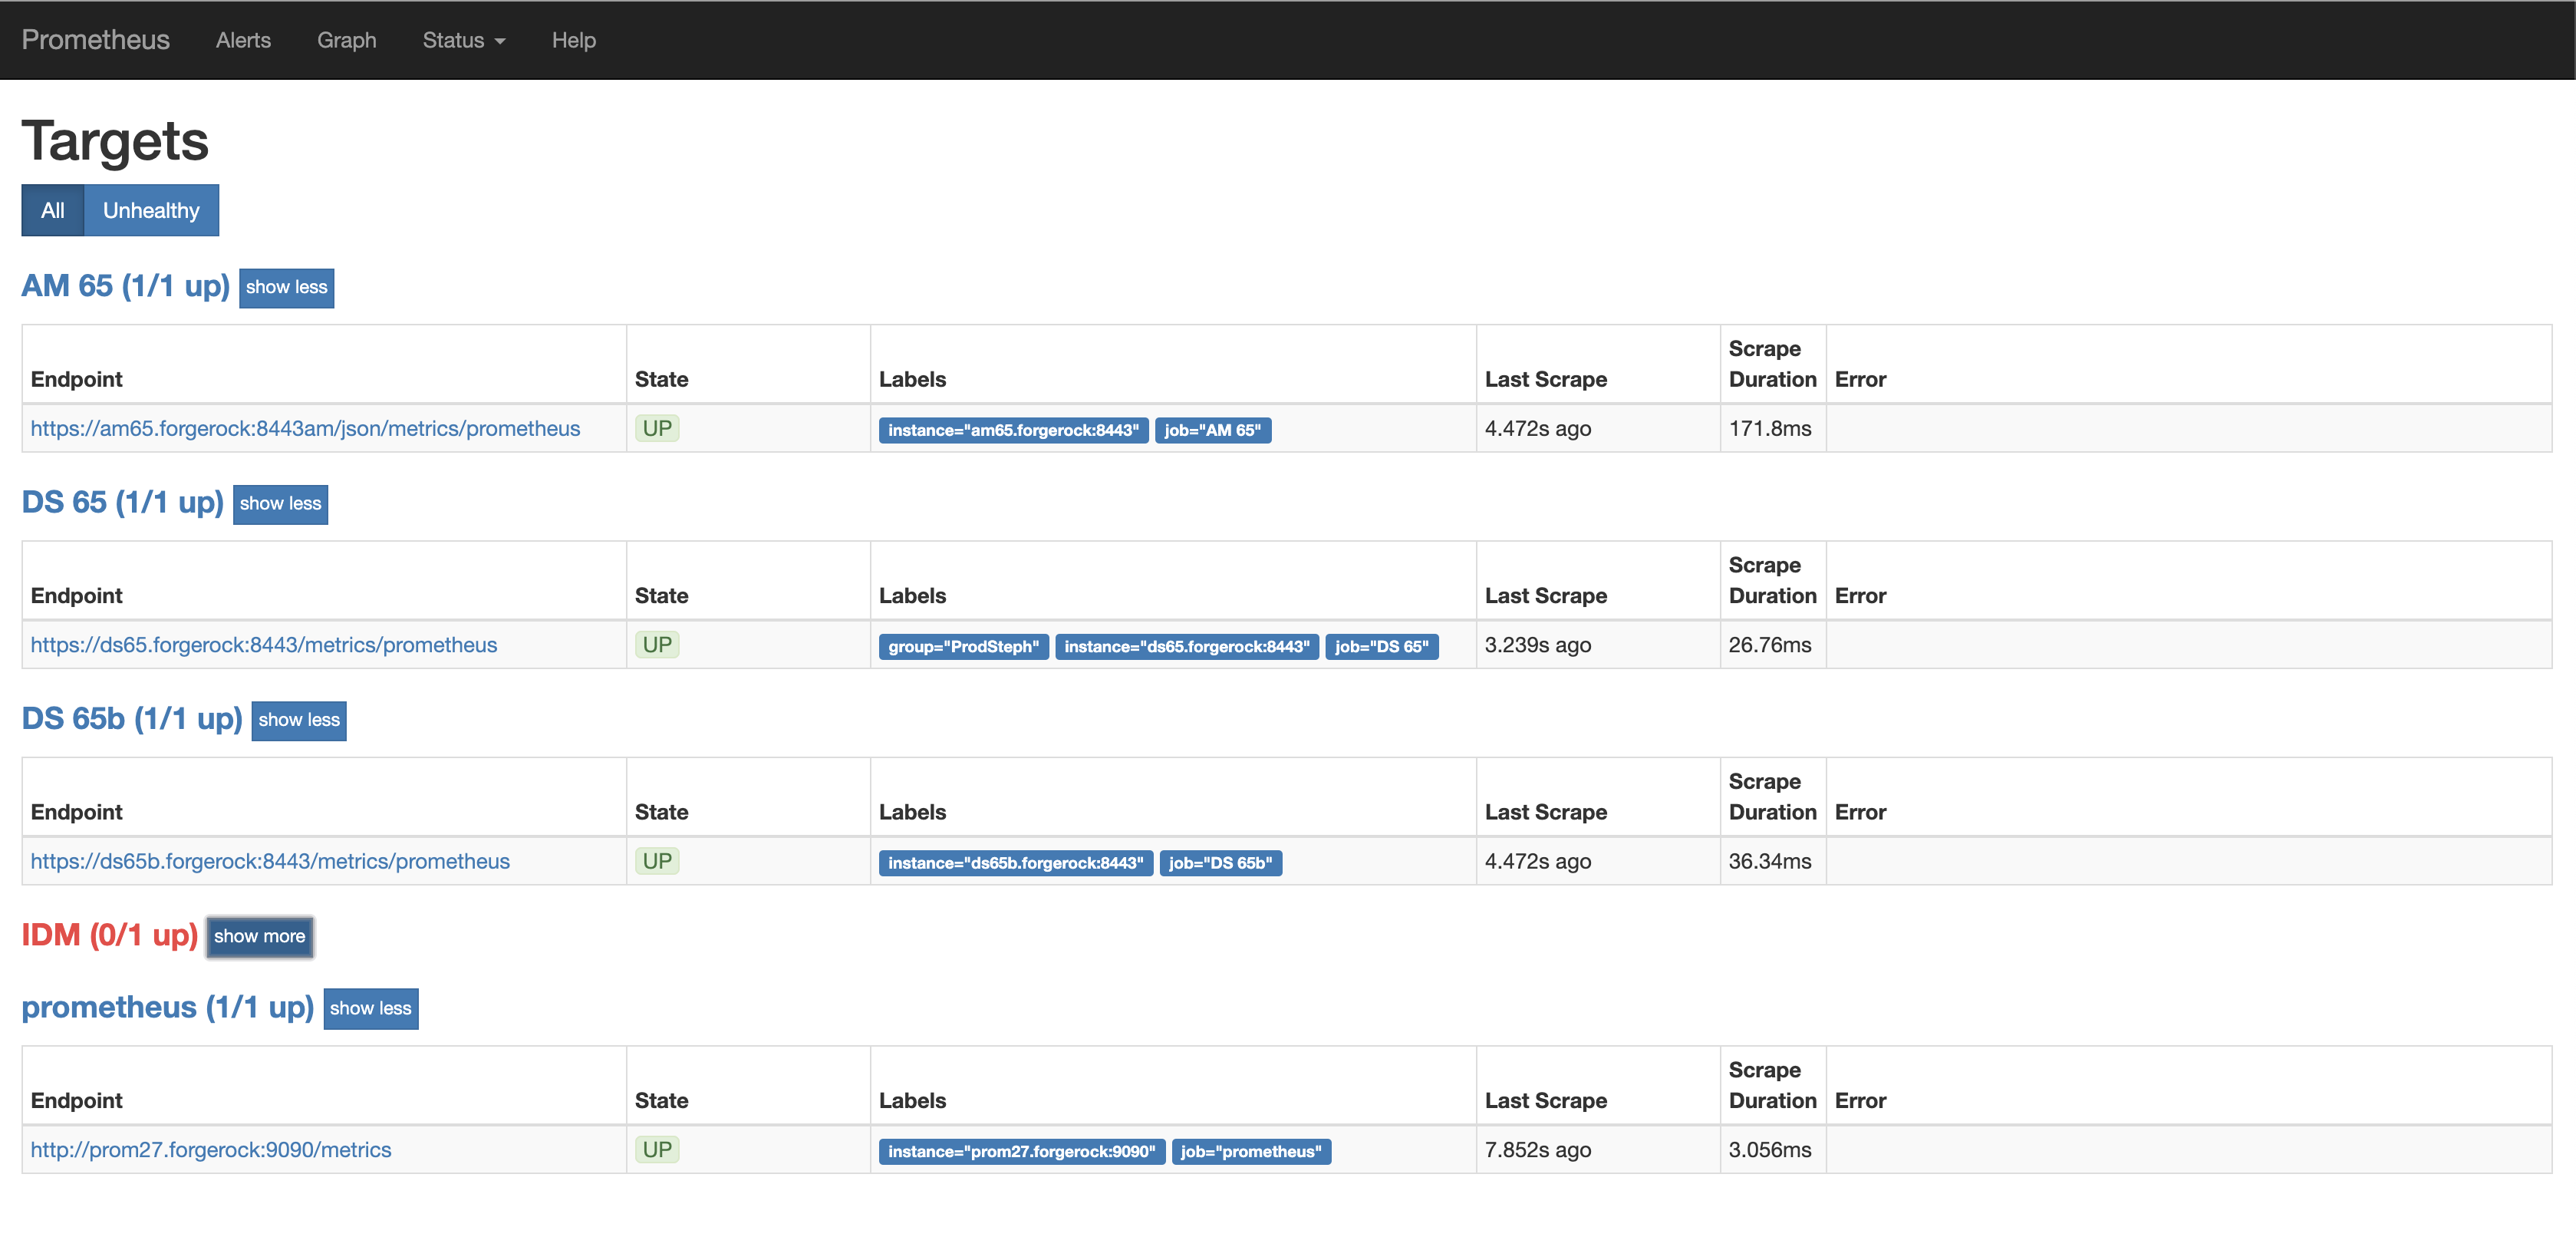
If you choose https, then you will have to configure the tls_config parameter. Note: In this example, the parameter configured to skip certificate verification; it shouldn’t be done in production environment. Finally, you have to configure Basic auth to authenticate Prometheus to your various ForgeRock’s Prometheus endpoints (these credentials have been defined in Part 1). Now, you just have to start Prometheus, connect to the Prometheus user interface, and browse the Targets menu. You should see a screen like the one below:
Configuring Grafana
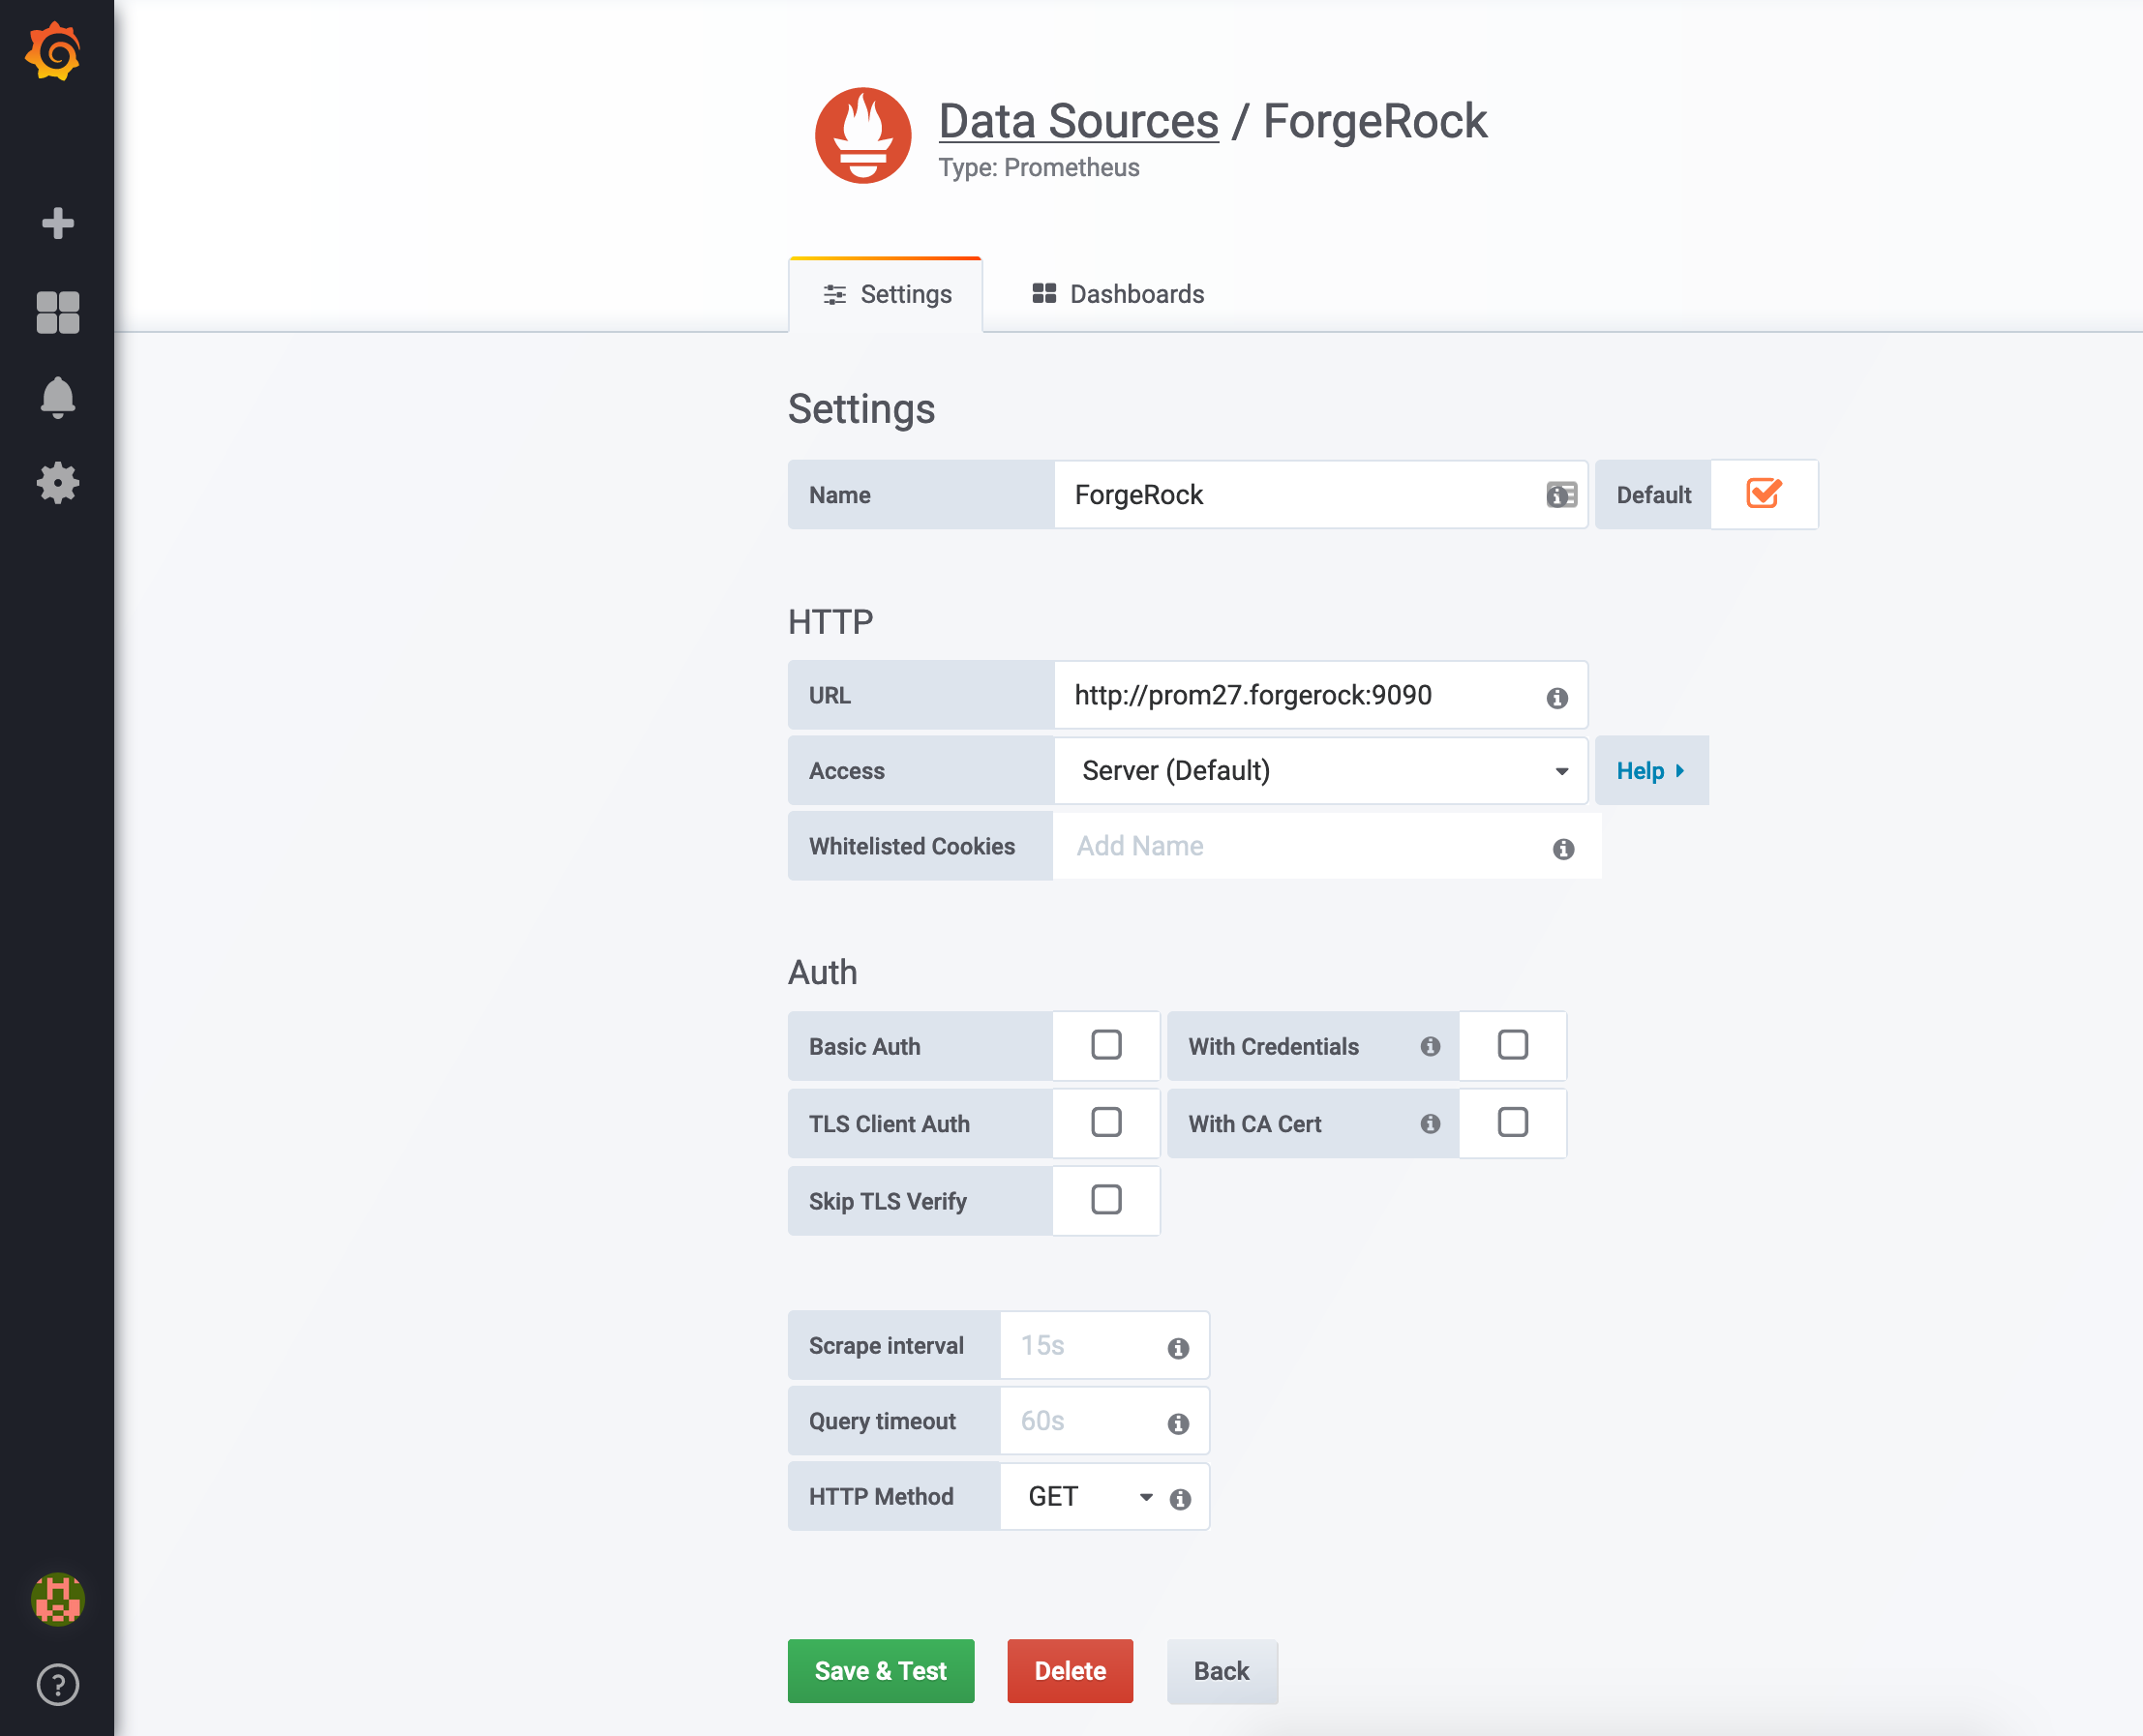
To configure Grafana, you just have to add the data source corresponding to Prometheus:
-
Log in to Grafana as an administrator.
-
Go to Configuration > Data Sources menu.
-
Click Add Data Source.
-
Select Prometheus, and complete the creation form with the information about your Prometheus server (at least the URL of the server).
The figure below shows my Prometheus datasource configuration in Grafana:
Using ForgeRock’s Grafana Dashboard Example
You can find a zip archive containing Grafana dashboard example for all ForgeRock components on BackStage’s download page:
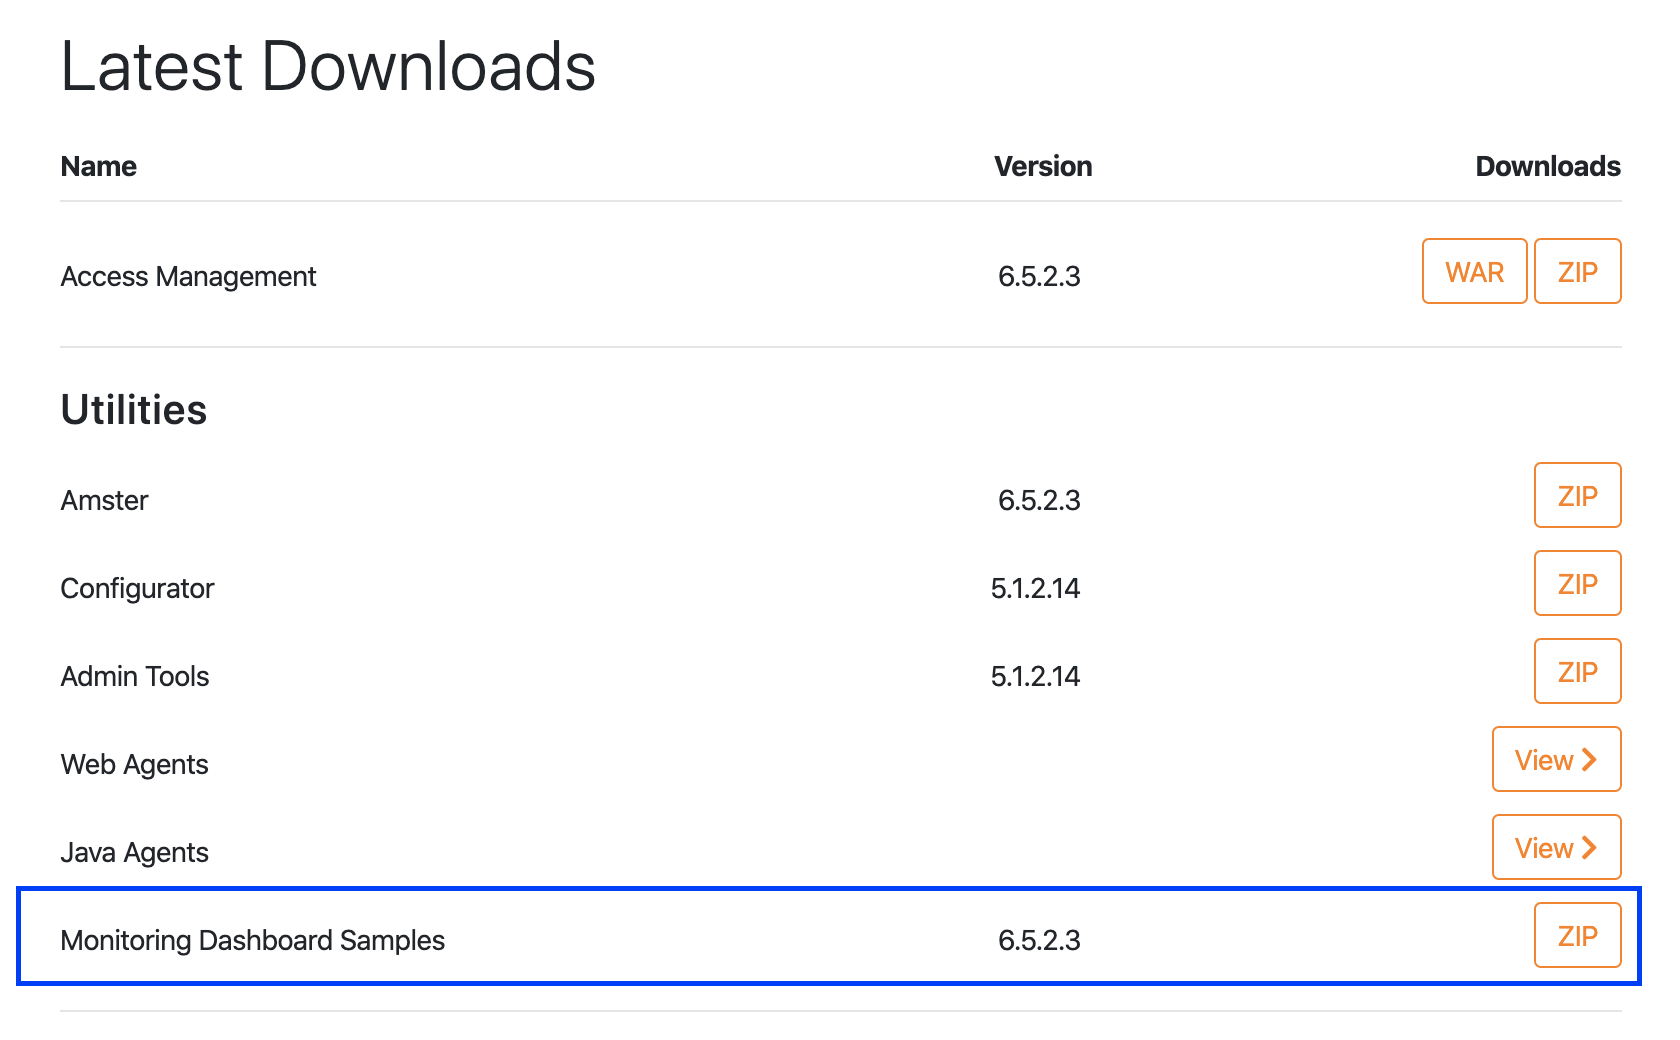
Download it and unzip it. You will see a directory containing the following:
-
json files. These are the dashboards you will import in Grafana.
-
README.md file. This file contains a step-by-step set up and configuration procedure.
To import the dashboards in Grafana:
-
Log in to Grafana as an administrator.
-
Go to Create>Import.
-
Click on Upload .json file.
-
Select your Prometheus datasource and click Import.
Et Voila ! Your dashboard is imported and you are redirected to it.
The figure that follows shows an example of a Directory Service dashboard:
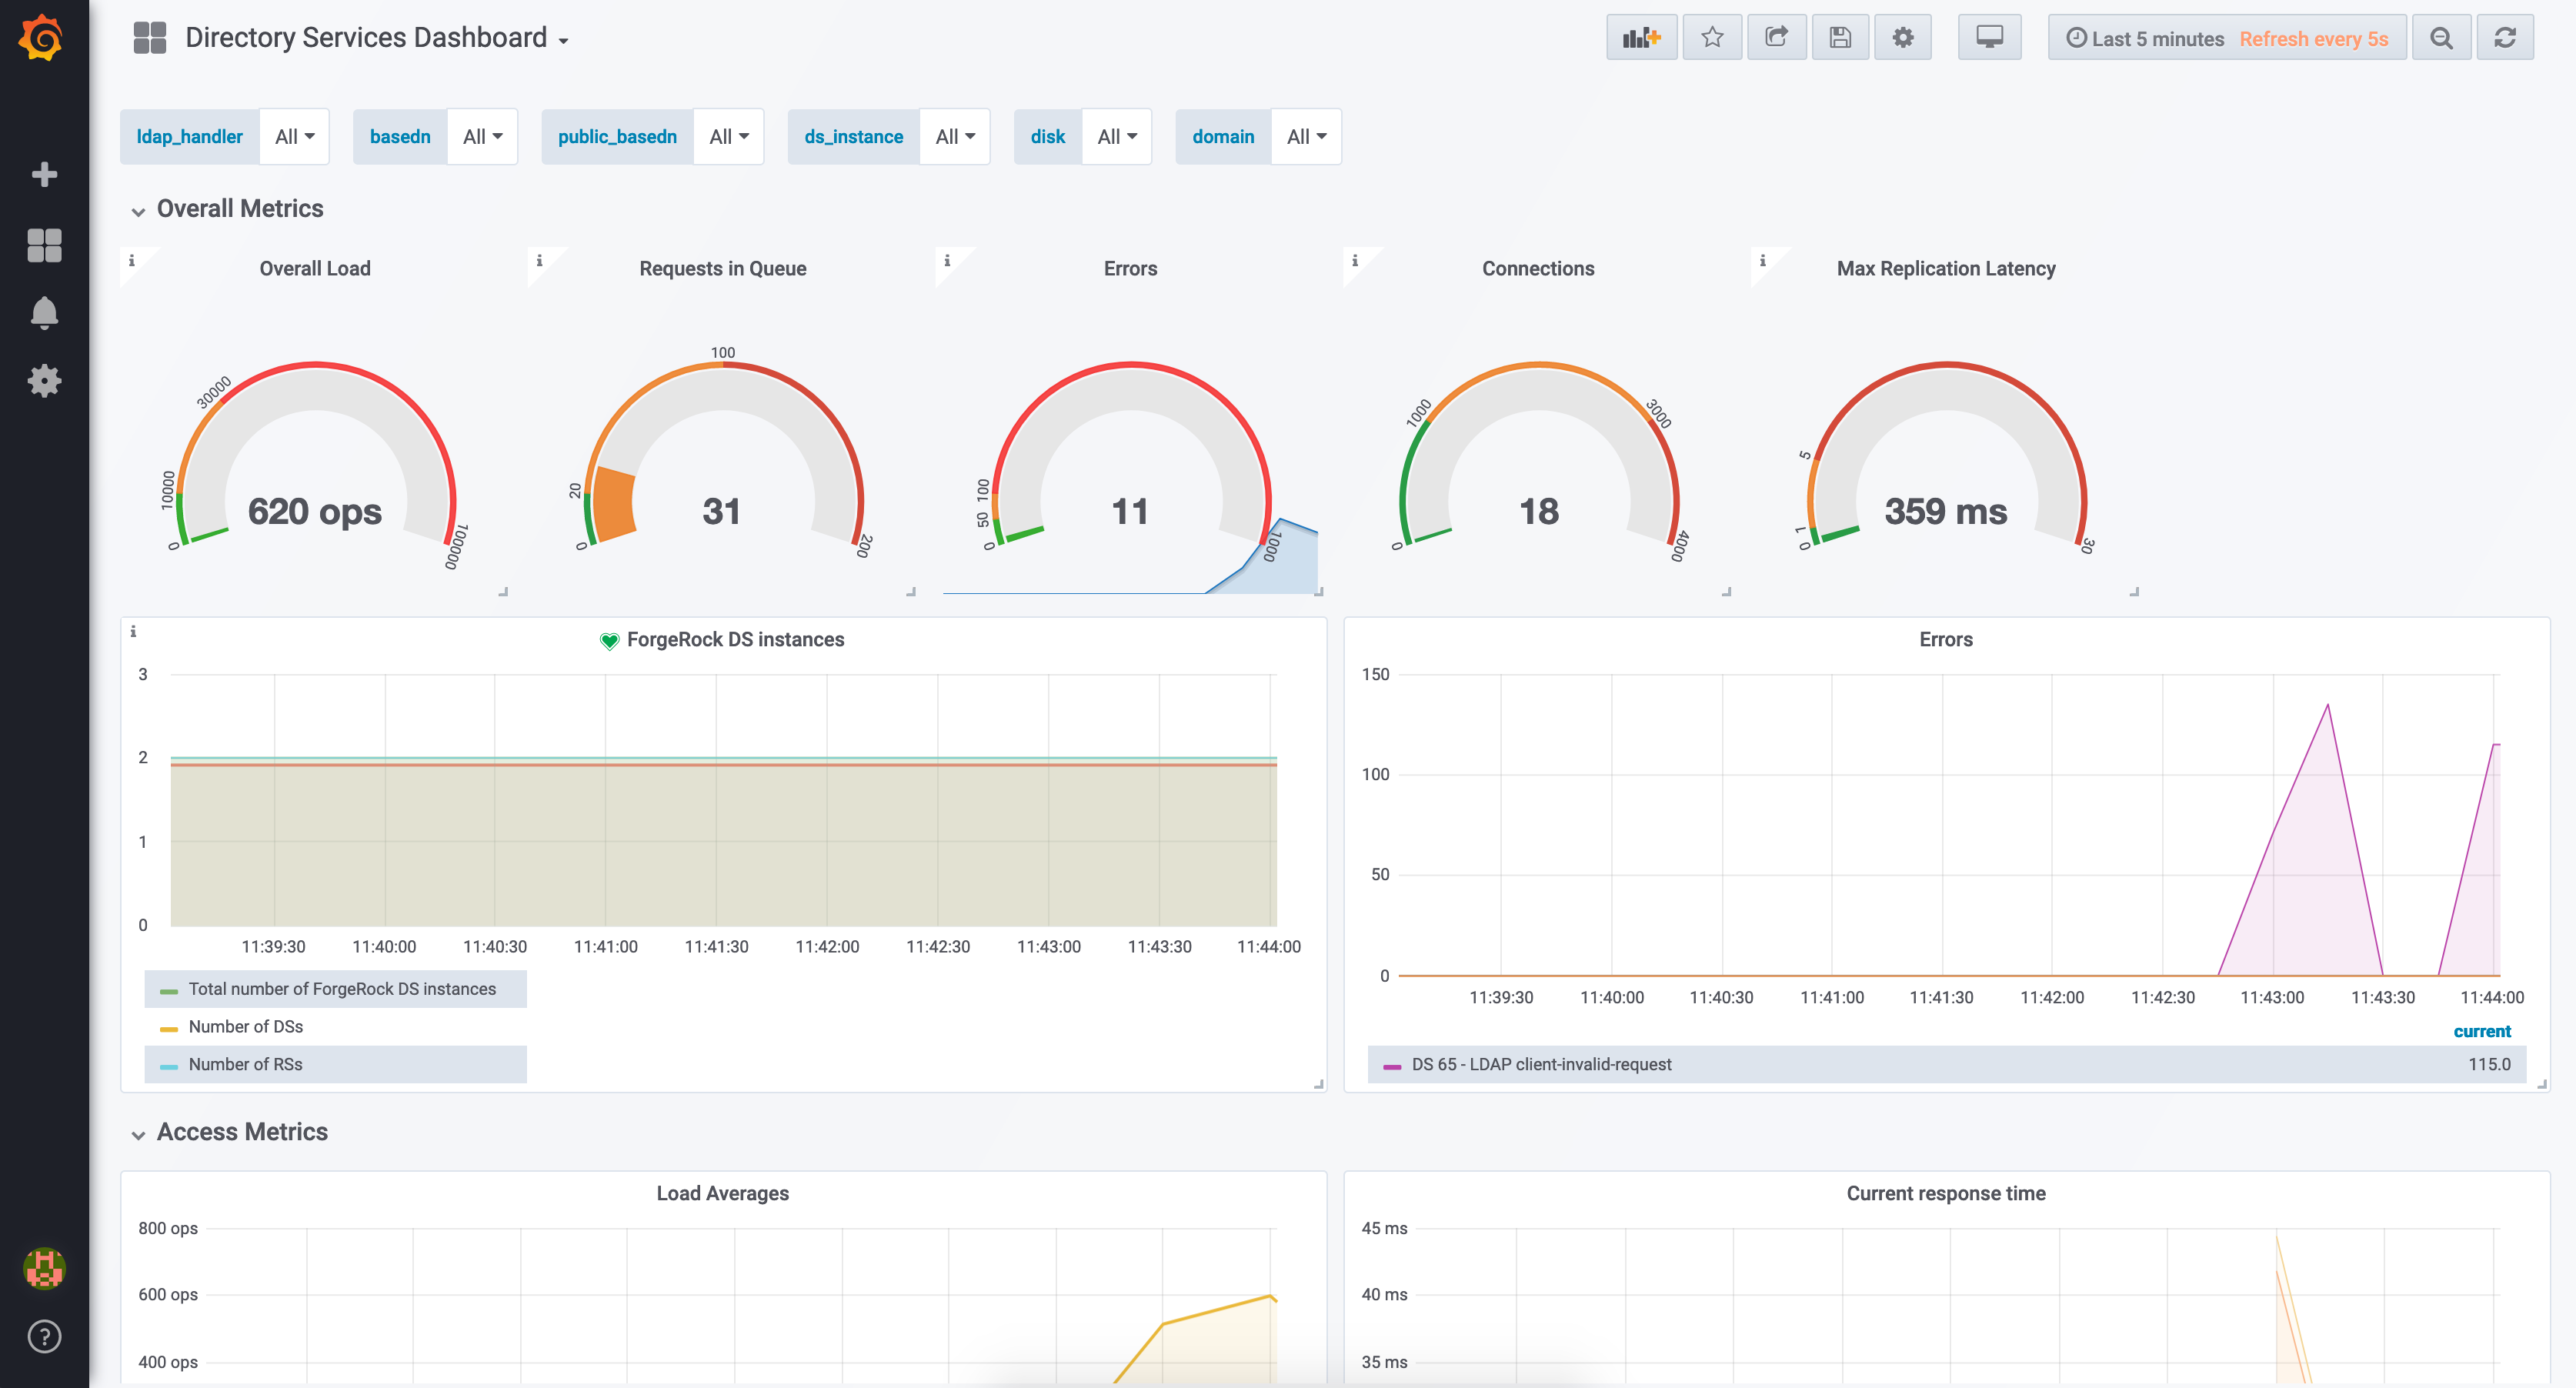
Note: don’t forget to import all the JSON files to get the dashboard in its entirety (a JSON file = a dashboard).
Conclusion (Part 2)
This concludes my series of articles explaining how to integrate ForgeRock, Prometheus, and Grafana. If you want to read more about the content of the dashboards ForgeRock provides, I suggest you read Craig McDonald’s article on the ForgeRock forum.
Finally, if you plan to deploy the solution in the cloud, note the ForgeRock Cloud Deployment Model provides a single script to deploy Prometheus, Grafana, and a number of sample dashboards.