Integrating the ForgeRock Identity Platform With Prometheus and
Author: |
Stephane Orluc |
Created at: |
May 2019 |
Updated at: |
Oct 2022 |
Summary
Integrating the ForgeRock Identity Platform With Prometheus and Grafana
Prometheus and Grafana are one of the most widely used monitoring stacks by DevOps Teams. Because our customer use of these tools has increased, we’ve included them in recent versions of ForgeRock products. In this article, we provide an overview of how Prometheus and Grafana are integrated with the ForgeRock Identity Platform.
Understanding Prometheus and Grafana
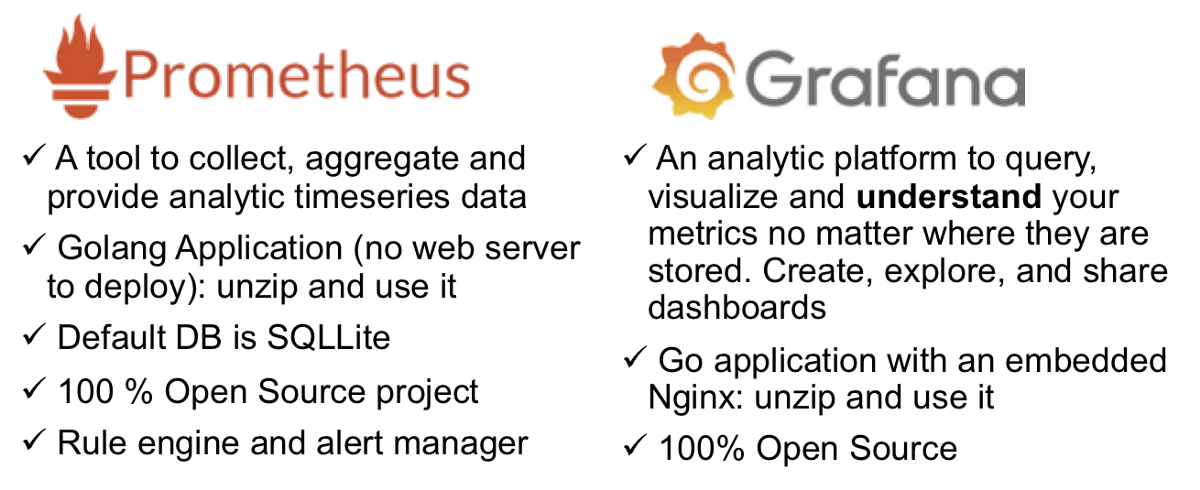
Prometheus and Grafana are part of a monitoring stack with overlapping functionalities that can also be used separately. This stack is being widely adopted by DevOps Teams because it is easy to deploy and use. The following figure is a rapid presentation of Prometheus and Grafana:

Example of Prometheus and Grafana in a nutshell
Note: You can navigate to their web sites to get a more detailed presentation .
Using ForgeRock Identity Platform With Prometheus and Grafana
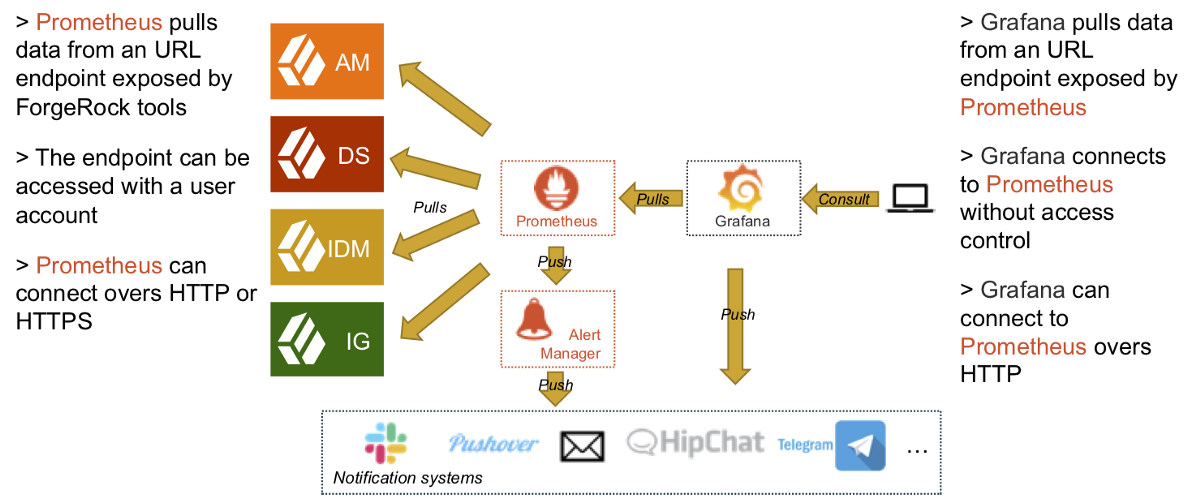
HTTP/HTTPS endpoints for gathering metrics are included with all of the components of the ForgeRock Identity Platform. These endpoints are meant to be polled regularly by Prometheus; all you need to do is configure it. Prometheus stores the endpoints locally, and you can define queries or variables to enrich the data. You can use Grafana to create a dashboard and alerts. As shown in the following figure, you can create a dashboard example to import in Grafana for all of the components of the ForgeRock Identity Platform. The following figure shows a high-level architecture:

Note: The communication between Prometheus and Grafana is not possible OOTB with SSL/HTTPS. You need to set up a reverse proxy in between.
Using ForgeRock Identity Platform and Prometheus Endpoints
All ForgeRock components can be polled by Prometheus as long as it is
activated. A Prometheus endpoint is a simple URL (protected or not) you
can access for metrics information. For example, with DS, you can access
the endpoint with this URL (default configuration):
http(s)://<DS ServerName>:<PortNumber>/metrics/prometheus where
<DS ServerName> is equal to the server where the endpoint is
available, and <PortNumber> is equal to the port define, most likely
8080 or 8443 depending on whether we’re using HTTP or HTTPS.
When you access the endpoint using a browser, the metics page should look something like this:
...
# HELP ds_backend_db_cache_misses_leaf_nodes Number of leaf nodes (data records) requested by btree operations that were not in the database cache
# TYPE ds_backend_db_cache_misses_leaf_nodes gauge
ds_backend_db_cache_misses_leaf_nodes{backend="dsEvaluation",type="db",} 129.0
# HELP ds_backend_db_cache_size_active_bytes Size of the database cache
# TYPE ds_backend_db_cache_size_active_bytes gauge
ds_backend_db_cache_size_active_bytes{backend="dsEvaluation",type="db",} 3275885.0
# HELP ds_backend_db_cache_total_tries_internal_nodes Number of internal nodes requested by btree operations
# TYPE ds_backend_db_cache_total_tries_internal_nodes gauge
ds_backend_db_cache_total_tries_internal_nodes{backend="dsEvaluation",type="db",} 88047.
...
A line basically contains the metric name, a few variables (backend, metric type, and so on), and a value equal to the value of the metric. There are four types of metrics: Counter, Gauge, Summary, and Timer. For information about these different types of metrics, read this Fhttps://backstage.forgerock.com/docs/ds/6.5/reference/#monitoring-types[orgeRock page].
Activating a Prometheus Endpoint in ForgeRock Products
Activating a Prometheus endpoint in ForgeRock components is straightforward. Instructions follow for activating a Prometheus endpoint on ForgeRock Access Management (AM), ForgeRock Identity Management (IDM), ForgeRock Directory Server (DS), and ForgeRock Identity Gateway (IG).
To Activate on AM
Connect to the AM web console and follow these steps:
-
Activate the monitoring globally. Go to Configure > Global services > Monitoring, and ensure that Monitoring Status is enabled.
The monitoring service must be enabled globally to activate the Prometheus endpoint, which is considered a secondary configuration. -
Add Prometheus as secondary monitoring configuration. Go to Configure > Global services > Monitoring and select Secondary Configurations. Select Add a Secondary Configuration, and then Prometheus Reporter.
-
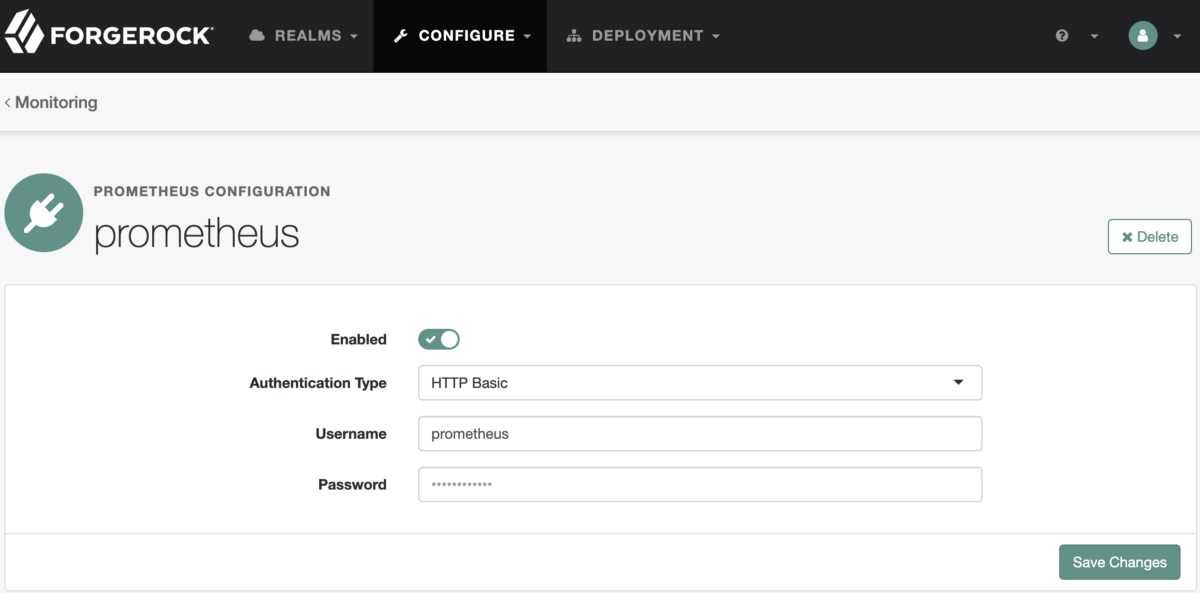
Activate Prometheus and add authentication to the endpoint. On the next page, enable the service by selecting HTTP Basic OAuth2 Authorization Service settings with enabled RCS:

Example Prometheus configuration in AM
To check the configuration, access the following URL with your favorite
web browser
http(s)://<AM InstanceName>:<AM port>/am/json/metrics/prometheus `where
`<AM InstanceName>
is equal to the AM instance server name where the
endpoint is available, and <AM port> is equal to the port number where
AM is available (it may be 8080 for HTTP or 8443 for HTTPS).
To activate in IDM
The Prometheus endpoint is already configured and enabled in IDM. An
authentication module is defined in the
<IDM-SETUM-PATH>/conf/authentication.json file. When Prometheus
accesses the endpoint, this module authenticates Prometheus using the
login and password defined in the file
<IDM-SETUP-PATH>/resolver/boot.properties. See a part of this file
below:
10: # Prometheus endpoint authentication 11: openidm.prometheus.username=prometheus 12: openidm.prometheus.password=prometheus
By default, the Prometheus endpoint is available at this URL :
http(s)://<IDM InstanceName>:<IDM port>/idm/metrics/prometheus , where
<IDM InstanceName> is equal to the IDM instance server name where the
endpoint is available, and <IDM port> is equal to the port number
where IDM is available (it may be 8080 for HTTP or 8443 for HTTPS).
To activate in DS
Connect to your DS host with a shell, navigate to the DS bin directory
<DS-SETUP-PATH>/bin, and start the dsconfig command:
-
First, manage HTTP endpoints. After connecting to your DS instance interactively with
dsconfig, enter 20 to select an HTTP endpoint. -
Create a new HTTP endpoint. On the next menu, enter 1 to select Create a new HTTP endpoint. During this step, you may enter 4 to List existing HTTP endpoints to determine whether there is an existing Prometheus endpoint enabled already.
-
Create a Prometheus Endpoint. On the next menu, enter 6 to create a Prometheus HTTP Endpoint.
-
Configure your Prometheus Endpoint URL. On this menu, you need to define the URL path of the endpoint. This is an absolute path from the root URL and must include a slash at the beginning. For example, if you enter
/metrics/prometheus, then your endpoint will be available at the following URL:http(s)://<DS ServerName>:<PortNumber>/metrics/prometheus, where<DS ServerName>is equal to the server where the endpoint is available, and<PortNumber>is equal to the port defined. This is most likely 8080 or 8443, depending on whether you are using HTTP or HTTPS.
5.Note: Depending on your DS setup, it is possible that the*/metrics/prometheusis defined already.
Note: Don’t forget the initial / when defining the URL. -
Select authentication mechanisms for the endpoint. On this menu, you can select one or many different authentication methods to access the URL. The easiest is HTTP Basic; enter 2 to select this method, then enter 1 to enable the endpoint.
-
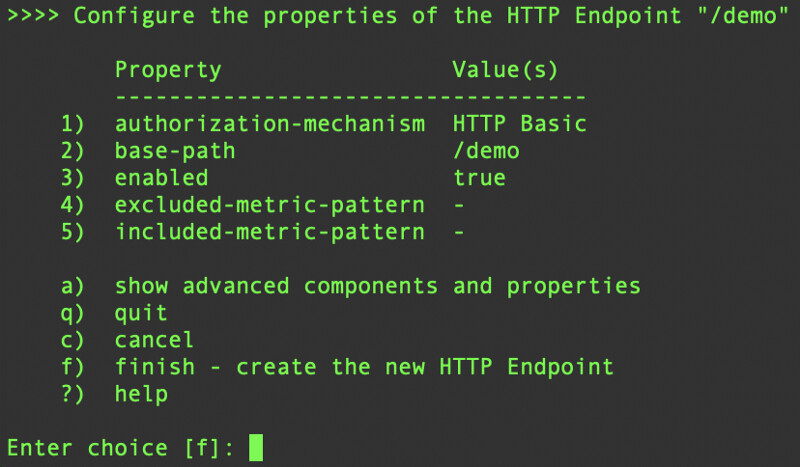
Check and start the endpoint. At this step, you get a summary. Enter f to finish, and start the Prometheus endpoint:

Prometheus endpoint check and start menu
The Prometheus endpoint is now available in DS. To check it, access the
following URL with your web browser at
http(s)://<DS ServerName>:<PortNumber><HTTPPromEndpoint> where
<DS ServerName> is equal to the server where the endpoint is
available, and <PortNumber> is equal to the port defined. This is most
likely 8080 or 8443, depending on whether you are using HTTP or HTTPS,
and <HTTPPromEndpoint> is equal to the path you defined in step
#4.
To activate in IG
The Prometheus endpoint for IG ships with the product, so no additional configuration nor activation is needed. However, unlike the other components of ForgeRock Identity Platform, this endpoint is not protected and can be accessed by anyone, as no special credentials are needed. To secure the endpoint with basic authentication in two steps, see “https://backstage.forgerock.com/docs/ig/6.5/gateway-guide/#proc-monitor-plat-protect[Protecting the Monitoring Endpoints].”
Learning More About Available Metrics
ForgeRock Identity Platform provides a variety of metrics for all the components. As these metrics are well-documented, here are the links to the information for each product:
-
AM metrics documentation: https://backstage.forgerock.com/docs/am/6.5/maintenance-guide/#sec-maint-monitoring-metrics
Note: this documentation is valid for all metrics tools supported by AM, not only Prometheus. -
IDM Prometheus metrics documentation: https://backstage.forgerock.com/docs/idm/6.5/integrators-guide/#prometheus-metrics
-
DS Prometheus metrics documentation: https://backstage.forgerock.com/docs/ds/6/reference/#monitoring-metrics-prometheus
-
IG Prometheus metrics documentation: https://backstage.forgerock.com/docs/ig/6.5/reference/#prom-route-metrics-prom & https://backstage.forgerock.com/docs/ig/6.5/reference/#prom-router-metrics-prom
Note: In addition to these standard metrics, it is possible to add custom ones. For example, you can create timers or probes in authentication trees to analyze the performance of your tree. We will discuss this topic in a future article.
Conclusion (Part 1)
In this article, we showed you howForgeRock, Prometheus, and Grafana are
integrated, and especially how ForgeRock Platform provides Prometheus
endpoints. In the next article (Part 2), we will explain how to
configure Prometheus with the prometheus.yml file, and how to use the
Grafana dashboard example ForgeRock provides for each component.